
Your 3:1 LTV:CAC is probably fake.
Not made up. Just measured on the wrong number. Most founders work out lifetime value (LTV) from revenue: how much a customer pays you over a year. Then they divide it by what it cost to get that customer (CAC, customer acquisition cost) and compare it with the famous 3:1 rule. On revenue, plenty of stores clear 3:1 easily. On the money they actually keep, many don't.
This guide shows the difference with one worked example, explains where 3:1 comes from and why it doesn't transfer to a store, works out the month each customer pays back, and shows the cash a whole cohort needs before it does. It's written for founders and owners of subscription and repeat-purchase brands, with enough detail for whoever runs the numbers.
The workbook takes your order value, order costs, CAC and month-by-month retention, and gives LTV on revenue and on margin, both ratios, your payback month, the most you can pay per customer, a cohort cash chart and a sensitivity grid. The brand and its numbers in this article are a fictional worked example.
Where 3:1 comes from
The rule is from David Skok's SaaS Metrics 2.0: LTV:CAC "should be higher than 3", and the months to recover CAC should be under 12 (Skok: SaaS Metrics 2.0). Skok is explicit about the fine print. The 3:1 guideline uses the simple LTV formula without a gross-margin adjustment, and assumes a gross margin of 80% or more.
That's software, where serving one more customer costs almost nothing. A store pays for the product, the box and the shipping on every single order. At 60% margin, revenue LTV overstates what you keep by two thirds compared with margin LTV. So either work out LTV on margin, or don't use 3:1 as your bar.
The worked example
A fictional coffee subscription brand:
| Input | Value |
|---|---|
| Order value | $45 |
| Product cost, shipping and packing, payment and app fees | $18 |
| Margin per order | $27 (60%) |
| CAC (Meta cost per purchase for a new subscriber) | $62 |
| New customers in the push | 10,000 |
And how many of them keep ordering, month by month (our assumption, not a benchmark):
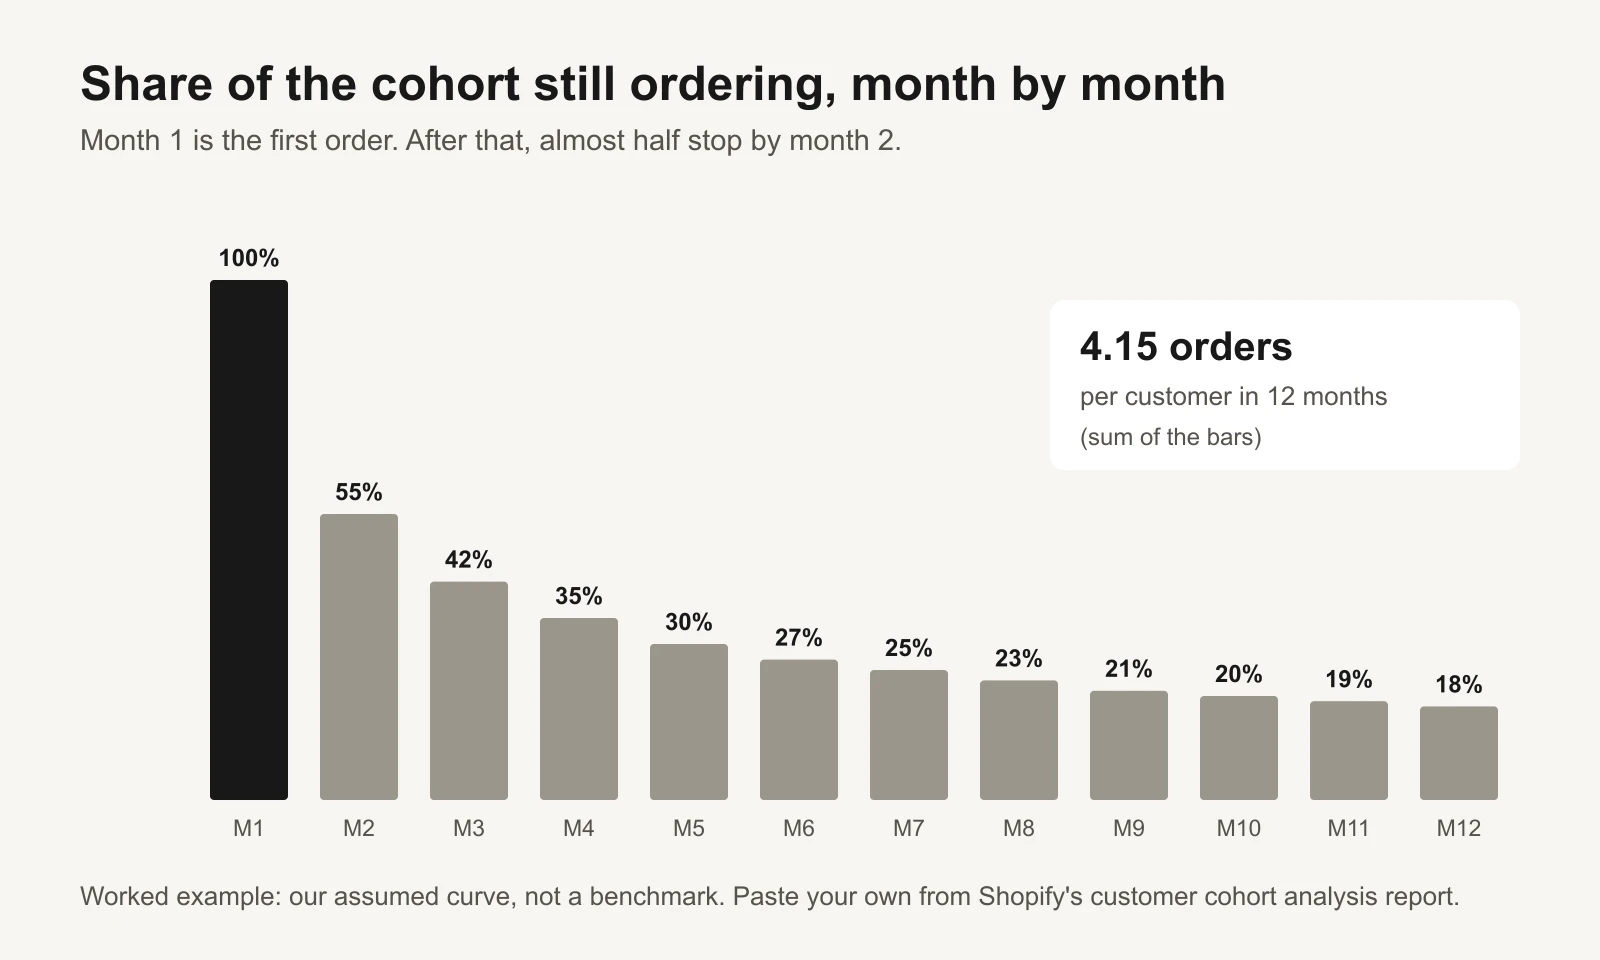
Worked example. Use your own curve from Shopify's customer cohort analysis report.
Add the bars and the average customer places 4.15 orders in 12 months: the first order plus 3.15 repeats.
The same customer, two LTVs
| On revenue | On margin | |
|---|---|---|
| 12-month LTV | 4.15 × $45 = $186.75 | 4.15 × $27 = $112.05 |
| ÷ CAC $62 | 3.0x | 1.8x |
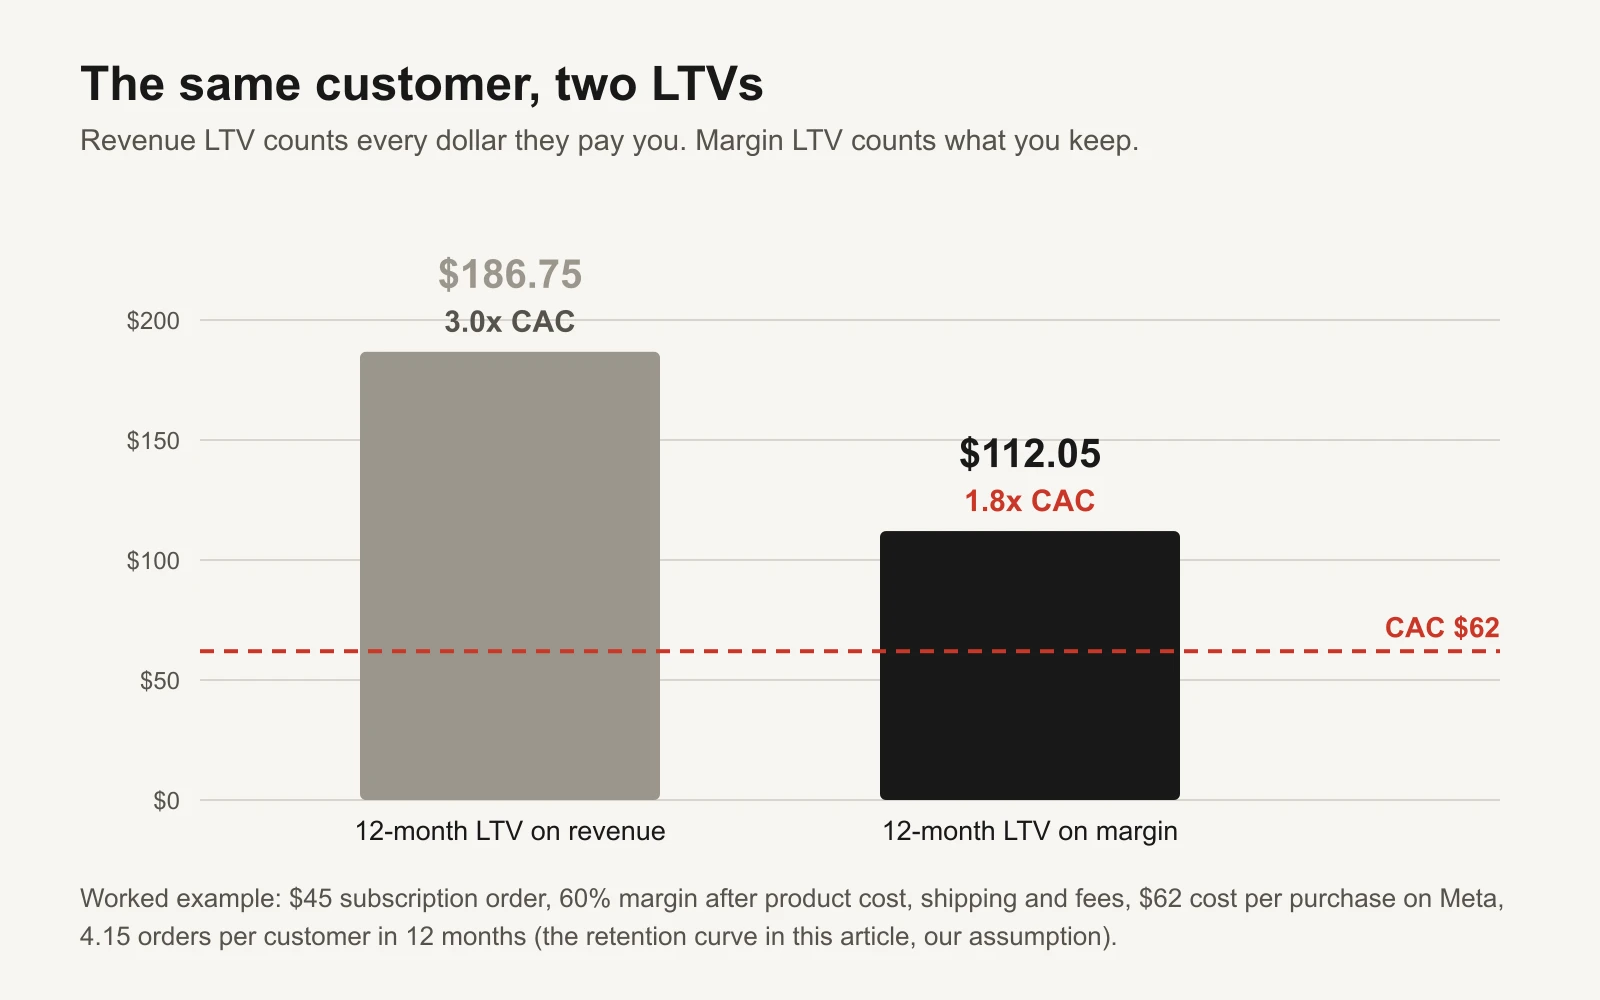
On revenue, this brand hits 3:1 and the deck says "scale it". On margin it's 1.8:1. Each new customer still earns back more than they cost within a year ($112.05 against $62), so this is a healthy, profitable channel. It is not the 3:1 the deck promised, and it has a cash cost the deck doesn't show.
When does the $62 come back?
Payback is the first month when the margin a customer has brought in covers what you paid to get them.
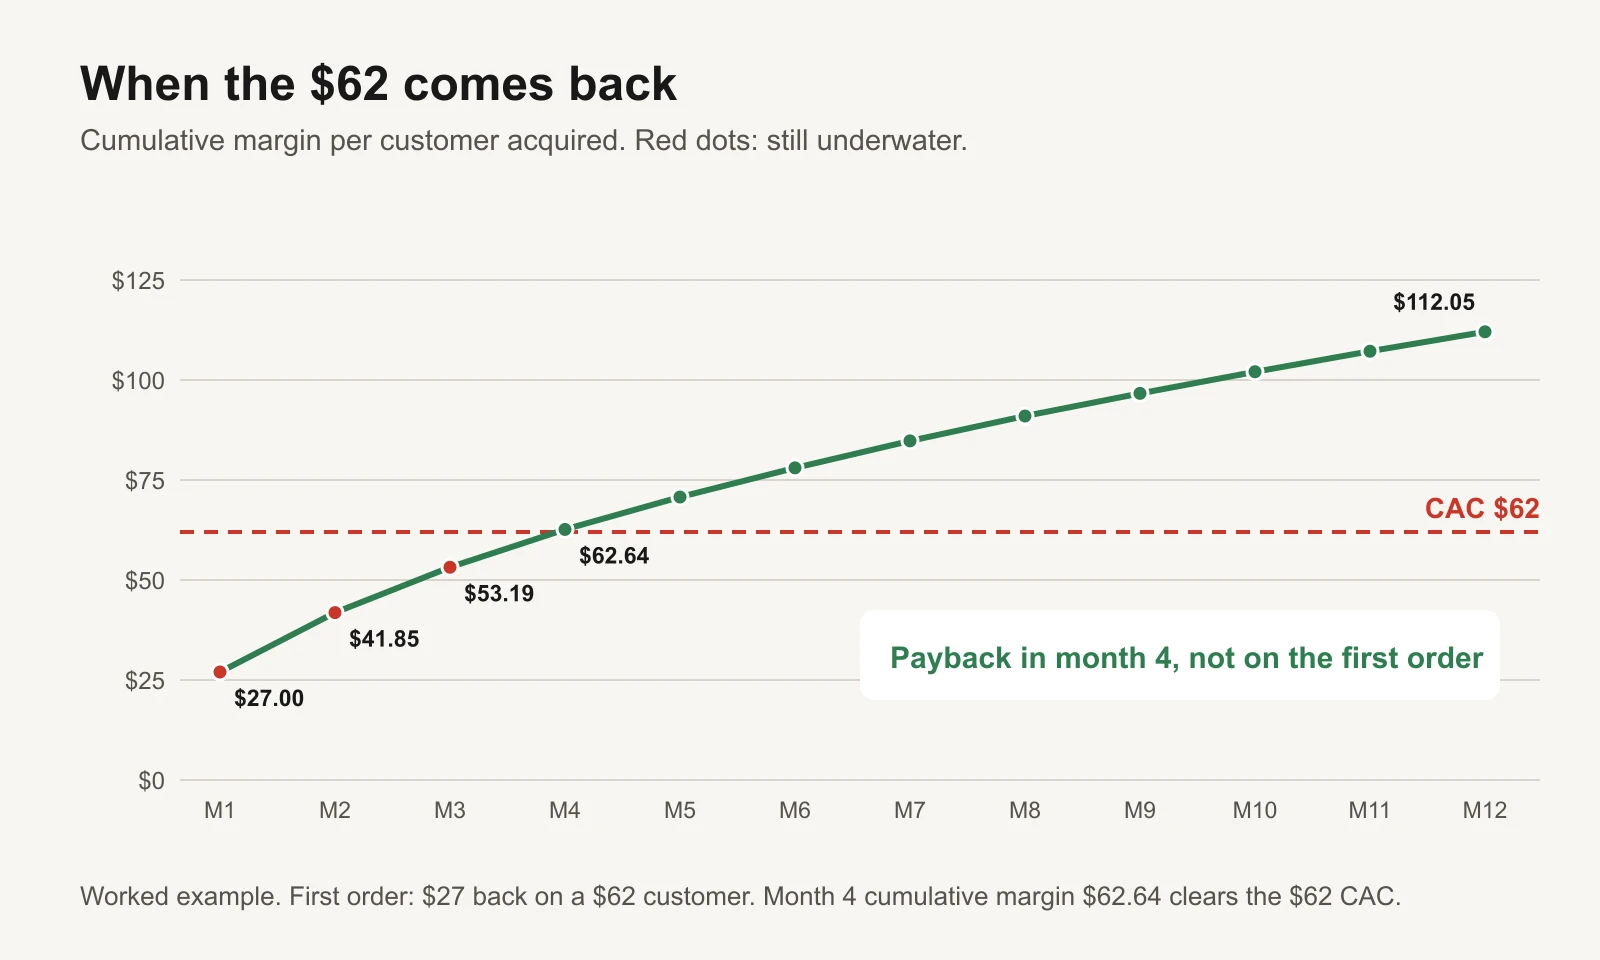
| Month | Margin from this month's orders | Cumulative margin | vs $62 CAC |
|---|---|---|---|
| 1 | $27.00 | $27.00 | −$35.00 |
| 2 | $14.85 | $41.85 | −$20.15 |
| 3 | $11.34 | $53.19 | −$8.81 |
| 4 | $9.45 | $62.64 | +$0.64 |
The first order brings back $27 on a $62 customer. The customer pays back in month 4. That's well inside Skok's 12-month guideline and fine for a subscription brand. The problem only shows when you multiply it by the number of customers you buy at once.
The cash gap when you scale
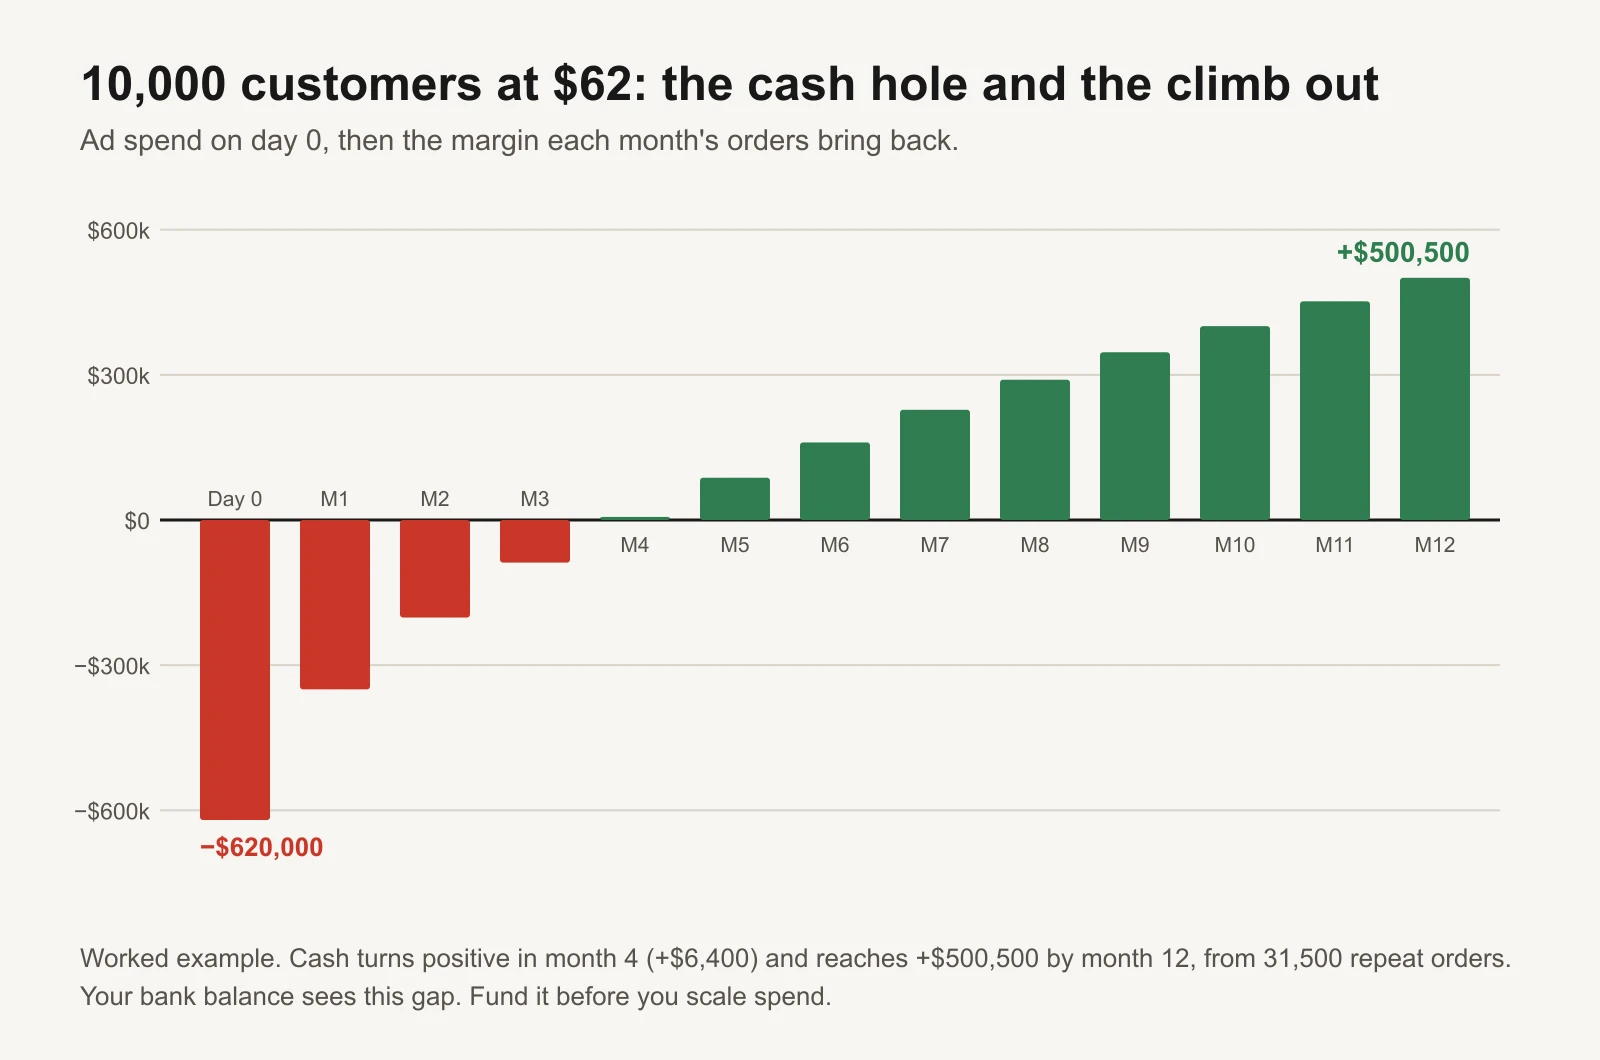
Buy 10,000 subscribers at $62 and you've spent $620,000 before the first box ships. The first orders bring back $270,000. The cohort's cash stays negative for three months, crosses zero in month 4 (+$6,400) and reaches +$500,500 by month 12, from 31,500 repeat orders.
That's a good result, and it's still $620,000 you have to have in the bank on day one. Founders who judge the push on "3:1, scale it" find out about the gap from their bank balance. Plan it instead: how much cash you need at the lowest point, and how many months until you get it back. Our guide to ad budgets and cash collection timing covers the bank side.
What you can afford to pay per customer
The same numbers answer the question you actually face when you set a budget: what's the most I can pay for a new customer?
| Rule | Most you can pay per customer |
|---|---|
| 3:1 on margin over 12 months | $112.05 ÷ 3 = $37.35 |
| Pay back within 6 months | Cumulative margin by month 6 = $78.03 |
| Pay back on the first order | $27.00 |
At $62, the example brand is paying more than the 3:1 rule allows and less than its 6-month payback limit. Which rule you pick is a cash decision, not a law. A brand with cash to fund a long payback can pay more per customer than one that needs its money back in a quarter. For one-off purchase stores, the first-order allowable CAC guide is the stricter version.
How to use the calculator
- Inputs. Order value, product cost, shipping and packing, payment and app fees per order, your CAC, how many customers, the LTV horizon (12 months by default) and your payback target.
- Retention. The share of the starting cohort that orders in each month. Month 1 is 100%. In Shopify, Analytics > Reports > Customer cohort analysis groups customers by their first order date (Shopify: customers reports). For a subscription, use the share still active and billed each month.
- Summary. LTV on revenue and on margin, both ratios with a verdict, payback month against your target, day-0 cash out, the cohort's cash at the end, and the most you can pay per customer.
- Cash charts the cohort month by month. Sensitivity shows LTV:CAC on margin for CACs from $30 to $110 and margins from 40% to 80%.
Use new-customer CAC, not blended. Blended CAC divides all ad spend by all orders, including repeat orders the ads didn't buy, and flatters the ratio again. The new-customer vs blended CAC guide explains the difference.
Or let GaaS buy customers against your real numbers
GaaS is an AI agent that creates, launches and optimises Meta and Google ads from three inputs: your website, a spend limit and a one-line goal. Give it a goal built from these numbers (a cost per new customer you can afford) and it works to that, and asks before anything that changes spend. If you'd rather run the maths yourself, the workbook is free.
Limits
- The retention curve in the example is our assumption. Your own cohorts are the only curve that matters, and young cohorts haven't shown you month 12 yet.
- Margin here is per order before ad spend. It leaves out fixed costs (staff, software, rent), so a ratio above 1x on margin doesn't mean the business makes a profit overall.
- Meta's cost per purchase can include repeat buyers and depends on attribution. New-customer CAC from your own data is better.
- The cash curve assumes everyone is acquired on day 0. A push spread over a month softens the dip but doesn't remove it.
- 3:1 is a SaaS rule of thumb. Payback and cash matter as much as the ratio.
Sources
- David Skok, For Entrepreneurs: SaaS Metrics 2.0, a guide to measuring and improving what matters
- Shopify Help Center: Customers reports