
"We're at a 2.0 ROAS, so we're doubling our money." It's one of the most expensive sentences in ecommerce.
A 2.0 ROAS means the ad platform credited your ads with $2 of orders for every $1 you spent. It says nothing about what those orders cost you to make, ship, take payment for and take back. Once you count those, plenty of stores at 2.0 are losing money on every order and don't know it.
This guide shows you how to set a ROAS target from your real order economics, in four steps. You can run your own numbers in the free ROAS target calculator. The workbook below does the same maths, then adds a per-product sheet, a return-rate table and a verdict on the ROAS you're getting today.
The store in this guide is a fictional worked example. Its numbers show how the maths works; they are not benchmarks. Where a number comes from outside, it has a link.
The short answer, in one table
Our example store sells a $60 linen shirt. Here is everything that happens to the $60.
| Input | Example value | Where to find yours |
|---|---|---|
| Average order value | $60 | Shopify: total sales ÷ orders, before tax |
| Product cost | $18 | Your supplier invoice or cost per item in Shopify |
| Shipping and packing you pay | $8 | Your shipping app or carrier invoices, per order |
| Card fee | 2.9% + 30¢ = $2.04 | Your payment plan. Shopify Basic in the US charges 2.9% + 30¢ for online standard cards (Shopify pricing) |
| Orders returned and refunded | 19.3% | Shopify: returns ÷ orders. 19.3% is the US online estimate for 2025 from the National Retail Federation and Happy Returns |
| Profit you want to keep | 15% of the order ($9) | Your choice |
| What you count | Break-even ROAS | Most you can pay per order |
|---|---|---|
| Product cost only (the 1 ÷ margin shortcut) | 1.43 | $42.00 |
| + shipping and card fees | 1.88 | $31.96 |
| + returns (true break-even) | 2.52 | $23.85 |
| + 15% profit (your target) | 4.04 | $14.85 |
ROAS means return on ad spend: order value credited to your ads ÷ ad spend. Break-even ROAS is the ROAS at which ads cost exactly what an order leaves you. Below it, every attributed order loses money.
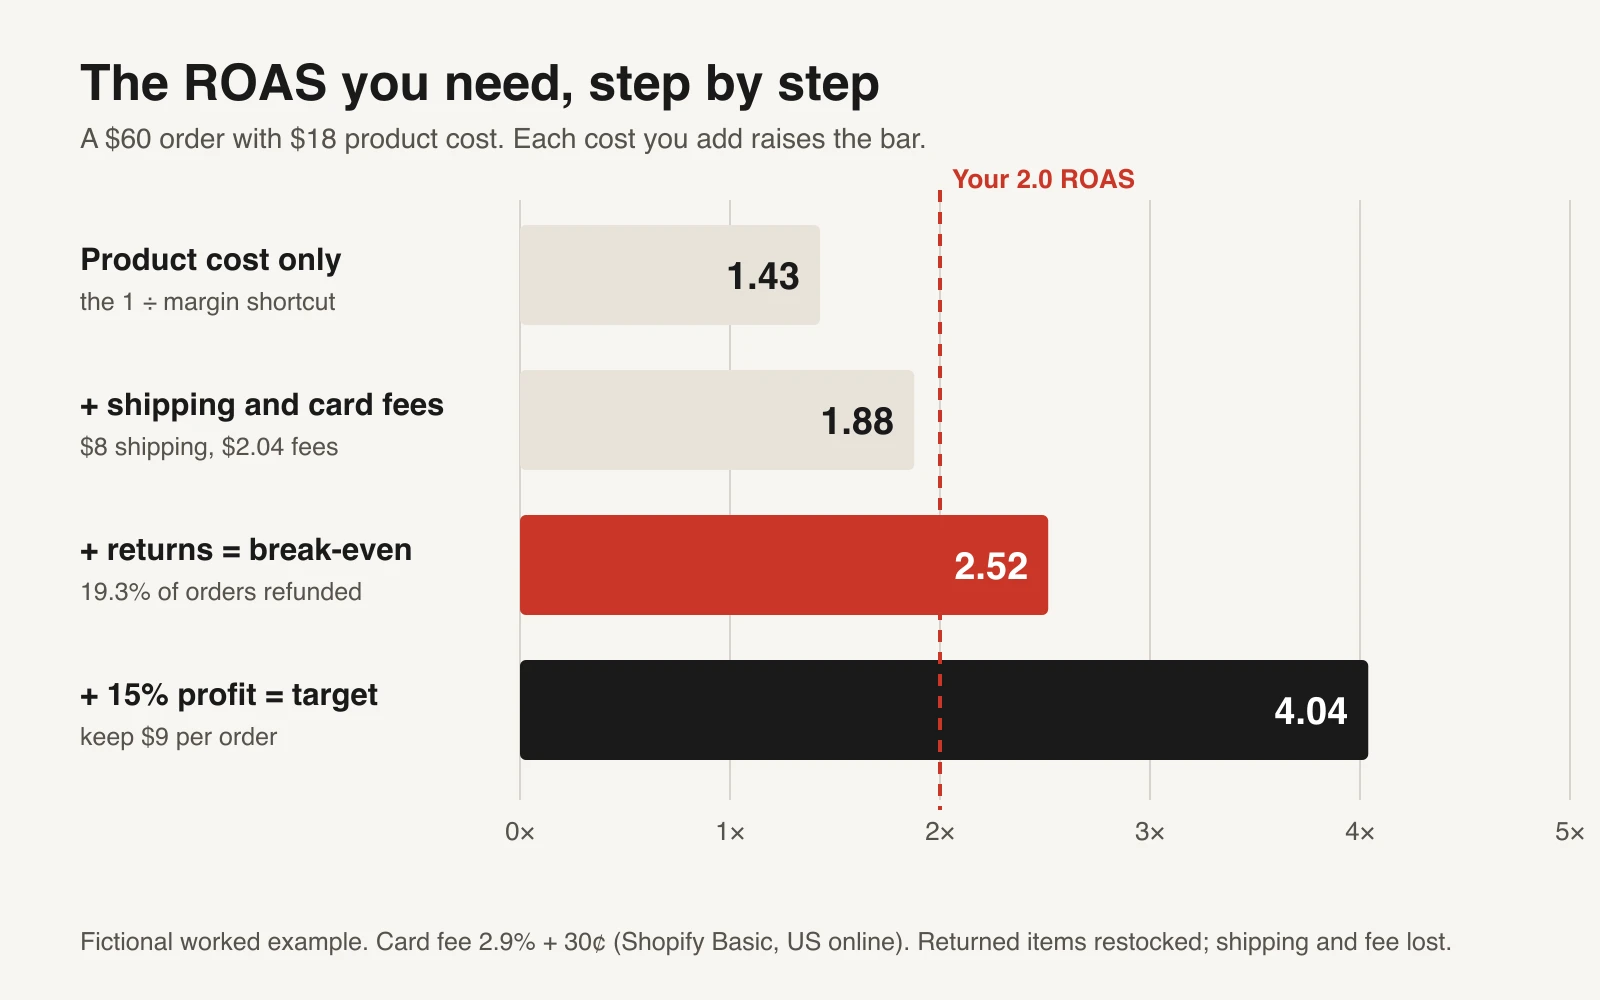
The 2.0 line clears the shortcut and nothing else. Fictional worked example.
Step 1: Start with what the product costs
The shortcut most people use is break-even ROAS = 1 ÷ gross margin. A $60 shirt that costs $18 has a 70% margin, so the shortcut says 1 ÷ 0.70 = 1.43.
That number is right about one thing: the product. If the only cost of selling the shirt were the shirt, a 1.43 ROAS would break even. But the shirt has to get to the customer, the customer has to pay, and one in five customers sends it back.
Step 2: Add shipping and payment fees
Shipping and card fees come out of every order, not just some.
- Shipping you pay: $8 (postage and packaging). If you charge the customer for shipping, include that in the order value and enter the full amount you pay here.
- Card fee: 2.9% of $60 is $1.74, plus 30¢, so $2.04. Shopify's Grow plan charges 2.7% + 30¢ and Advanced 2.5% + 30¢ for US online standard cards (Shopify pricing). On a $60 order, moving from Basic to Advanced saves 24¢, which is why fees are rarely the big lever.
A kept order now leaves $60 − $18 − $8 − $2.04 = $31.96, and break-even ROAS is 60 ÷ 31.96 = 1.88.
Step 3: Add returns (the step everyone skips)
Here's the part that catches people out. The ad platform counts the $60 sale the moment the order is placed. If the customer sends the shirt back three weeks later, Meta and Google don't take the sale away. Your ROAS stays the same; your bank balance doesn't.
When an order is returned in our example:
- the customer gets the $60 back,
- the shirt goes back on the shelf (so the $18 isn't lost),
- the $8 you paid to ship it is gone,
- the $2.04 card fee is gone too. Shopify Payments doesn't return the card processing fee when you refund an order (Shopify Help Center). Other providers have their own rules.
So a returned order costs you $10.04 and earns nothing. If you pay for return labels, or can't resell some returned items, that cost is higher. The calculator has a field for it.
How many orders come back? The NRF and Happy Returns estimated that 19.3% of US online sales would be returned in 2025, against 15.8% for retail overall (NRF, October 2025). That's roughly one order in five. Return rates vary a lot by category and by store, so use your own rate if you have it.
Now weight the two outcomes:
Contribution per order = 80.7% × $31.96 − 19.3% × $10.04 = $25.79 − $1.94 = $23.85
Break-even ROAS = $60 ÷ $23.85 = 2.52
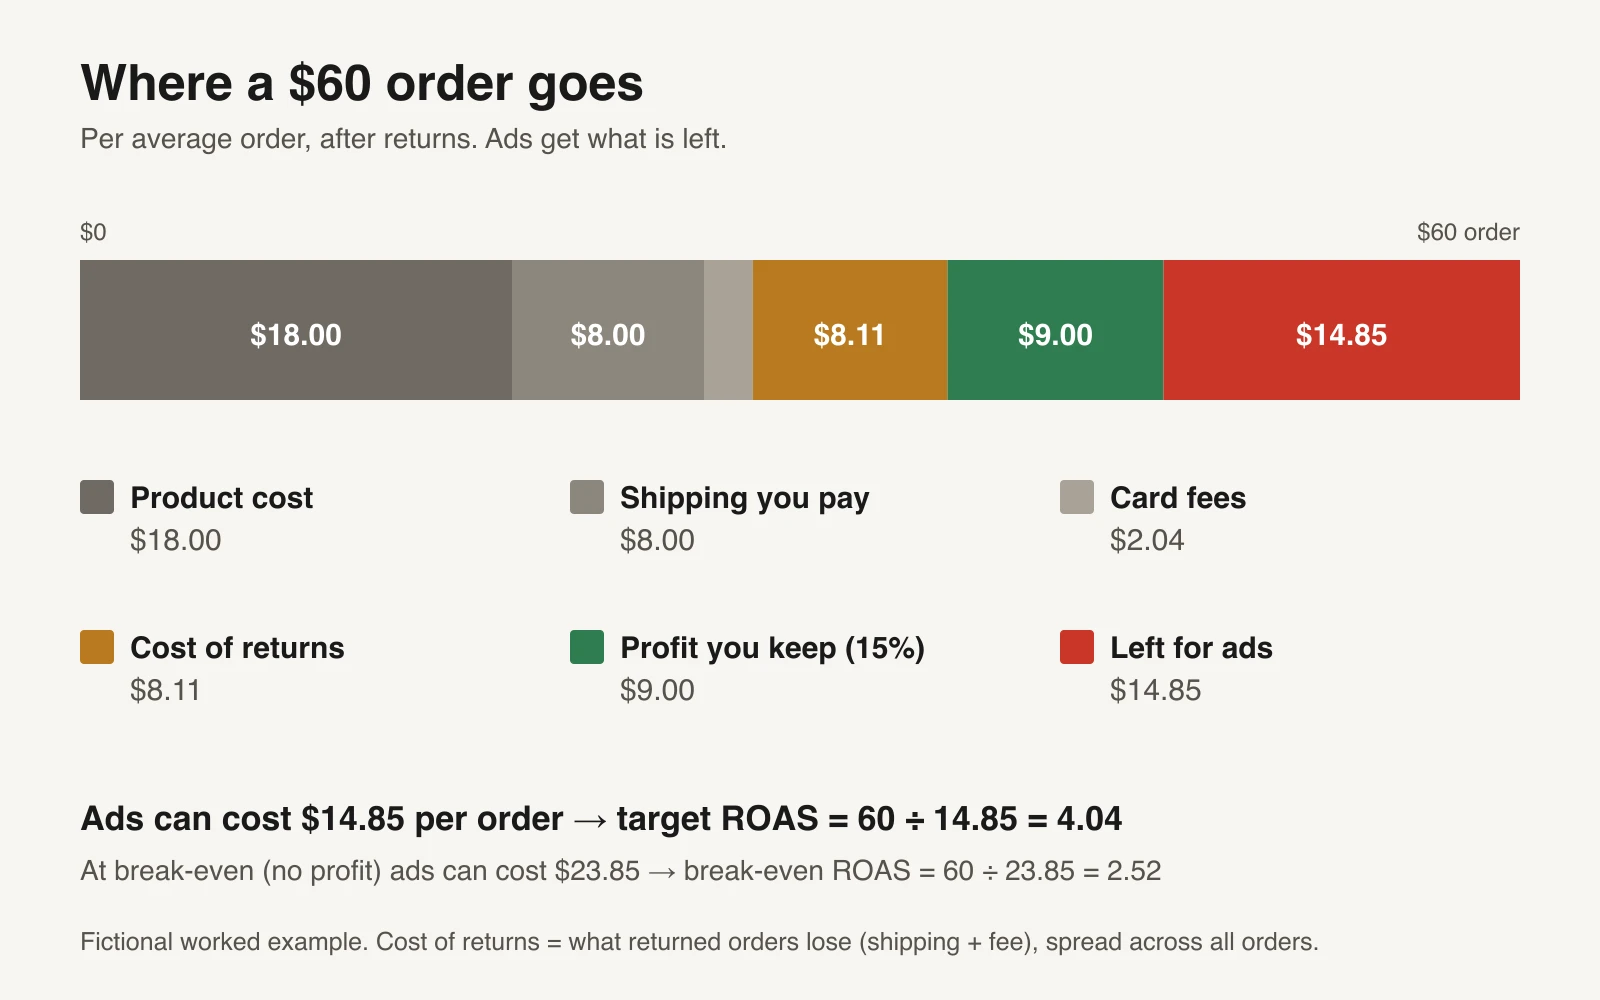
Per average order, after returns. "Cost of returns" is the drop from $31.96 to $23.85: what returned orders lose, spread across every order. Fictional worked example.
Notice that returns cost this store more per order ($8.11) than shipping ($8) and four times the card fees. That's why the step matters: it moves break-even from 1.88 to 2.52.
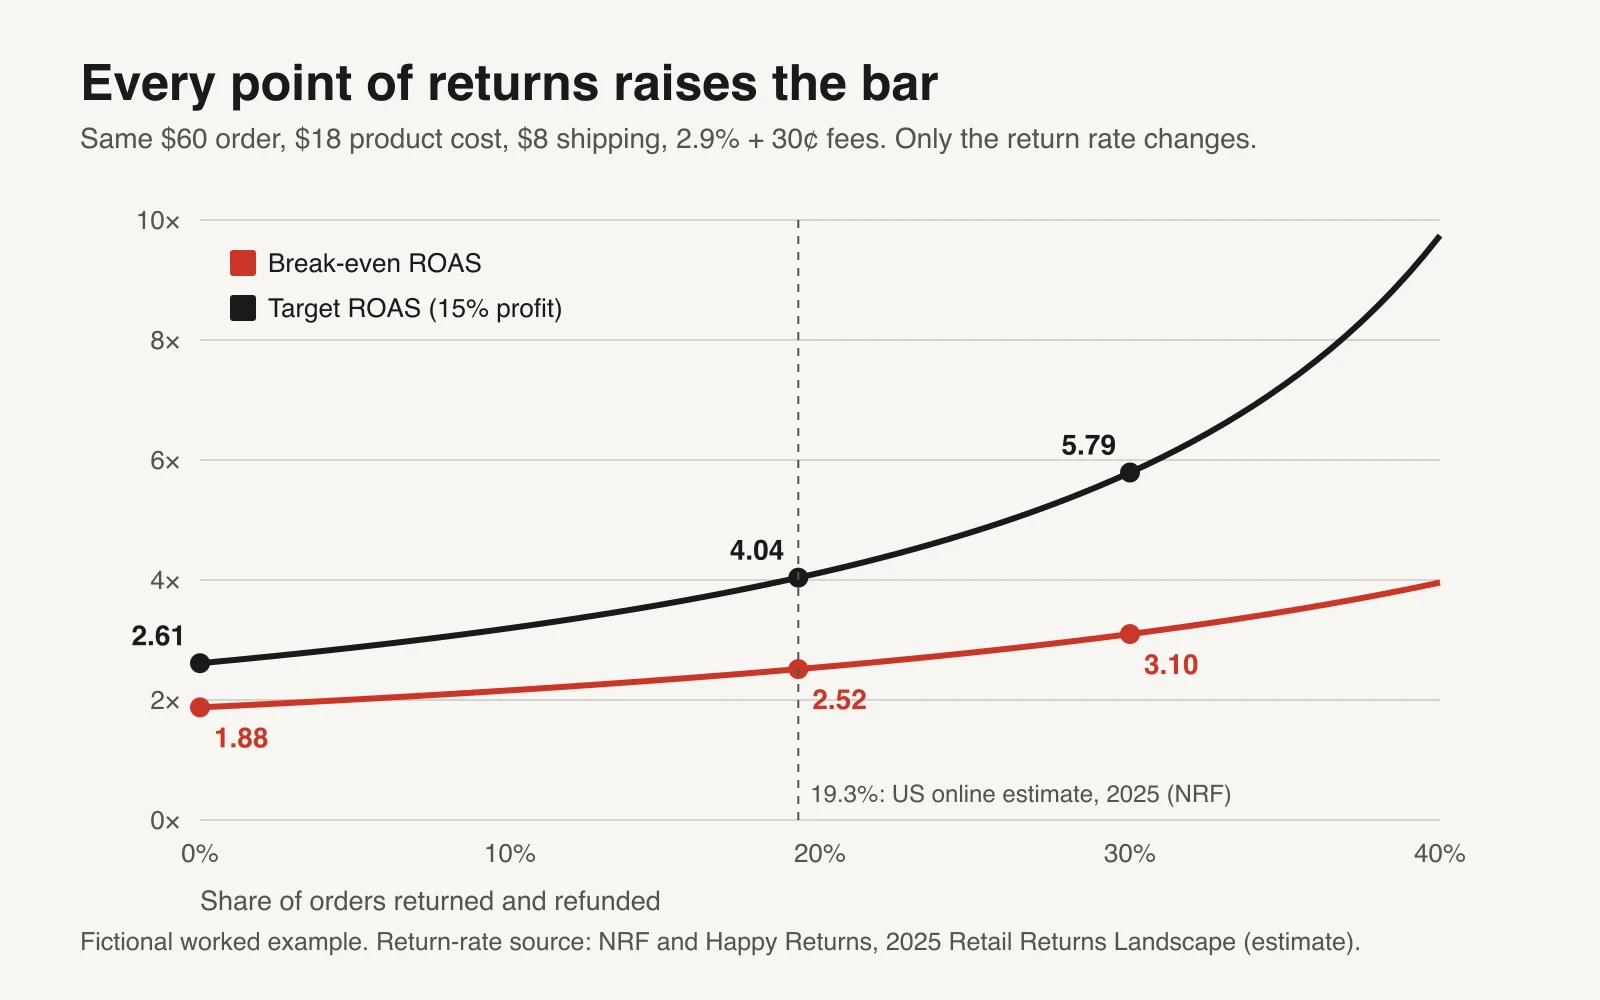
The curve gets steeper as returns rise. A store with 30% returns needs a 3.10 ROAS just to stand still. Fictional worked example.
Step 4: Decide what you want to keep
Break-even is the floor, not the goal. At break-even every order pays for its own ad and leaves nothing for rent, salaries, software or you.
Pick a profit you want per order after ads. Our example uses 15% of the order value, which is $9. Take that off the $23.85 and $14.85 is left for ads:
Target ROAS = $60 ÷ ($23.85 − $9) = 4.04
There's nothing special about 15%. Use the number your business needs after overhead. The point is to set it on purpose, before you look at the ads.
What your current ROAS really means
Once you know your break-even and target, any ROAS your ads report turns into profit or loss per order. The ad cost per order is $60 ÷ ROAS. Subtract it from the $23.85 each order leaves you:
| ROAS your ads report | Ad cost per order | Profit per order | Verdict |
|---|---|---|---|
| 1.5 | $40.00 | −$16.15 | Losing money |
| 2.0 | $30.00 | −$6.15 | Losing money |
| 2.5 | $24.00 | −$0.15 | Just below break-even |
| 3.0 | $20.00 | +$3.85 | Profitable, below target |
| 4.0 | $15.00 | +$8.85 | Just below the 15% target |
| 5.0 | $12.00 | +$11.85 | Above target |
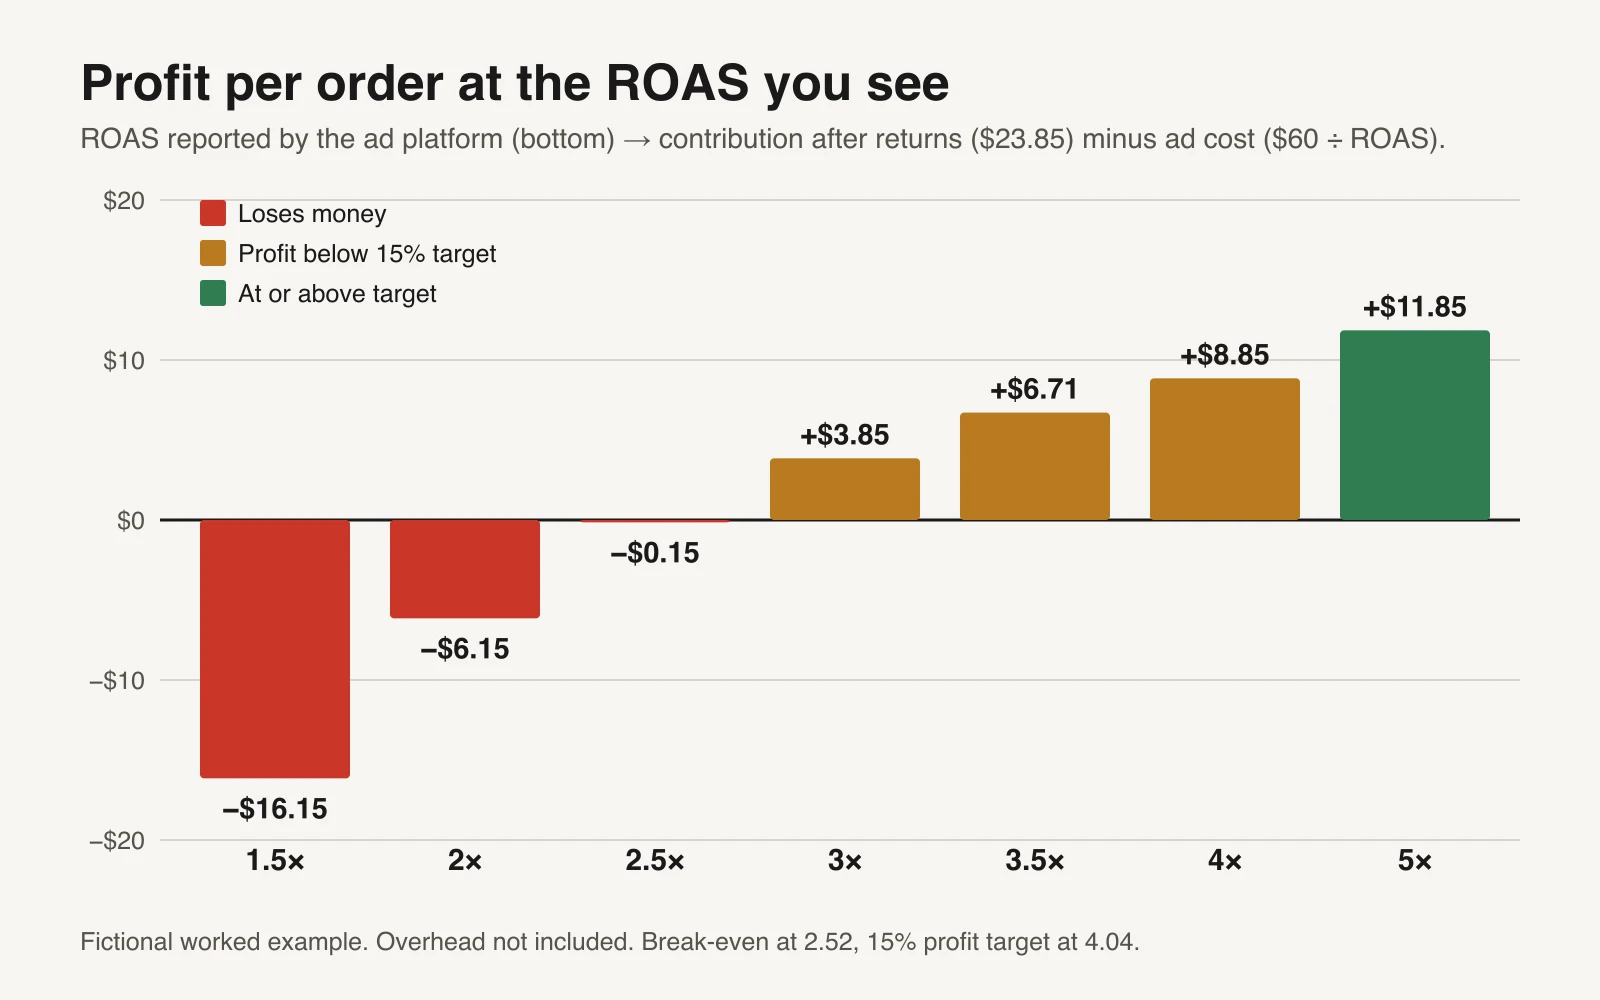
Profit per order at the ROAS you see. Overhead not included. Fictional worked example.
So in this example the "2.0 ROAS, doubling our money" store is losing $6.15 every time it makes a sale. Scaling it just loses money faster.
How to use the targets
Use break-even as the line to cut, and target as the line to scale.
- Below break-even (2.52 here): the ads are losing money on every order. Cut or fix them. Don't raise the budget hoping it gets better.
- Between break-even and target: the ads pay for themselves but don't make the profit you want. Hold the budget and work on the ads, the offer or the order value.
- At or above target (4.04 here): these are the ads to give more money, carefully. Our Kill / Hold / Scale rulebook covers how fast.
Set the target in the ad platform, if you use one. Google's target ROAS bidding and Meta's ROAS goal both take a number. Enter one you calculated, not one you were told. If you're moving a Google target, our guide to changing a target ROAS explains how to step it rather than jump.
Check it against your whole store. Platform ROAS counts sales the ads didn't cause and misses some they did. Once a month, divide total store revenue by total ad spend (your MER, or marketing efficiency ratio) with the MER calculator. If platform ROAS says you're above target but MER keeps falling, the platform is claiming sales it didn't add. Our guide to MER and platform ROAS goes deeper.
Every product has its own target
One target for the whole store hides the products that lose money. In the workbook's Products sheet, the same store's other products look like this (all fictional):
| Product | Price | Return rate | Break-even ROAS | Target ROAS (15%) | ROAS today | Verdict |
|---|---|---|---|---|---|---|
| Linen shirt | $60 | 19.3% | 2.52 | 4.04 | 2.0 | Below break-even |
| Linen trousers | $85 | 28% | 2.83 | 4.93 | 3.1 | Between break-even and target |
| Two-shirt bundle | $110 | 15% | 2.23 | 3.34 | 3.6 | At or above target |
| Gift box | $45 | 8% | 2.38 | 3.70 | 3.4 | Between break-even and target |
| Socks 3-pack | $24 | 5% | 2.16 | 3.20 | 1.9 | Below break-even |
Two things stand out. The trousers have a healthy-looking 3.1 ROAS but a 28% return rate, so they barely clear break-even. And the bundle breaks even at a lower ROAS than the single shirt (2.23 against 2.52), because its bigger order spreads shipping and fees over more revenue. If you run a bundle test, this is the maths behind it. If some products come back far more than others, our guide to return rates by ad creative shows how to find the ads that bring in returners.
Common mistakes
- Using 1 ÷ margin. It ignores shipping, fees and returns. In this example it understates break-even by 43%.
- Using net revenue on one side and gross on the other. Ads Manager reports the order value at purchase. Keep that on top of the ratio and put returns in the costs, as this calculator does, or use refund-adjusted revenue everywhere. Don't mix them.
- Counting tax as revenue. Sales tax and VAT aren't yours. Leave them out of order value.
- Forgetting free-shipping thresholds and discounts. If most orders use a code, your average order value is the discounted one. During a sale, recalculate: the Black Friday playbook does this for each offer.
- One target for every product. See the table above.
- Never updating it. Supplier prices, carrier rates and return rates change. Recalculate quarterly, and whenever one of them moves.
How to use the workbook
| Tab | What it does |
|---|---|
| Start here | Instructions, plain-English definitions and the sources |
| Calculator | Your eight inputs, every step from product-cost-only to target ROAS, the most you can pay per order, a verdict on your current ROAS, input checks and a chart of the ROAS ladder |
| Products | Up to 20 products or bundles, each with its own break-even and target ROAS and a red / amber / green verdict |
| Return rate effect | Break-even and target ROAS at nine return rates, with a line chart |
Yellow cells with blue text are yours to change. Grey cells are formulas. Example rows are fictional; overwrite them.
Or let GaaS hold the line for you
GaaS is an AI agent that makes, launches and manages ads from three inputs: your website URL, a spend limit and a one-line goal. Give it your margins and it works to a target like the one above, and asks before anything spends. The arithmetic in this guide works the same either way.
What this calculator can't tell you
- Whether the ads caused the sales. It takes platform ROAS at face value. Test that against MER and, for big decisions, a holdout test. Our guide to attribution and incrementality explains the difference.
- Repeat purchases. It values the first order only. If customers reliably come back, you can accept a lower first-order ROAS, but base that on your own repeat data. The allowable CAC calculator helps.
- Overhead. Break-even here is per order. Rent, salaries and software are on top.
- Your return policy's details. It assumes returned items are restocked and refunded in full. Add damaged or unsellable items to the extra cost per return.
If you already know your costs per order as a single number, the simpler break-even ROAS calculator and our guide to contribution margin do the same core maths without the itemised fields.
Sources checked 17 November 2026. Fees and return-rate estimates change; check the linked pages before you rely on a specific number.