
Monday morning. Ads Manager says last week's ads drove 120 purchases. Shopify says 70 orders came from Facebook and Instagram. Your media buyer quotes the first number; your accountant believes the second. One of them must be wrong.
Neither is lying, and neither is right. They're answering two different questions with two different rulebooks. Once you know the rules, the gap stops being a mystery and becomes something you can measure every week, and use.
This guide explains the six reasons Meta and Shopify disagree, walks through a week where 120 becomes 70 step by step, and shows which number to use for which decision. The free workbook does the reconciliation every week: a log, a bridge from one number to the other, a tracking checklist and a decision guide.
The 120 and the 70 come from a fictional example store. They show how the method works, not what your gap should be. Facts about how Meta and Shopify count have a link to the source.
Two rulebooks, one set of sales
Meta's question: "Did this person see or interact with our ad shortly before they bought?" If yes, Meta counts the purchase for the ad.
Shopify's question: "Which channel sent the visit that led to this order?" By default, Shopify's marketing reports give all the credit to the last non-direct click: the last channel a customer came from before buying, ignoring direct visits (Shopify Help Center).
Meta's default attribution setting for website purchases is 7-day click, 1-day view and 1-day engage-through (Jon Loomer, 2026). In March 2026 Meta narrowed "click" to link clicks only and renamed engaged-view to engage-through, which now covers conversions after a like, comment, share or save as well as engaged video views (Meta, 3 March 2026). Meta said the change was meant to bring its reporting closer to third-party tools like Google Analytics.
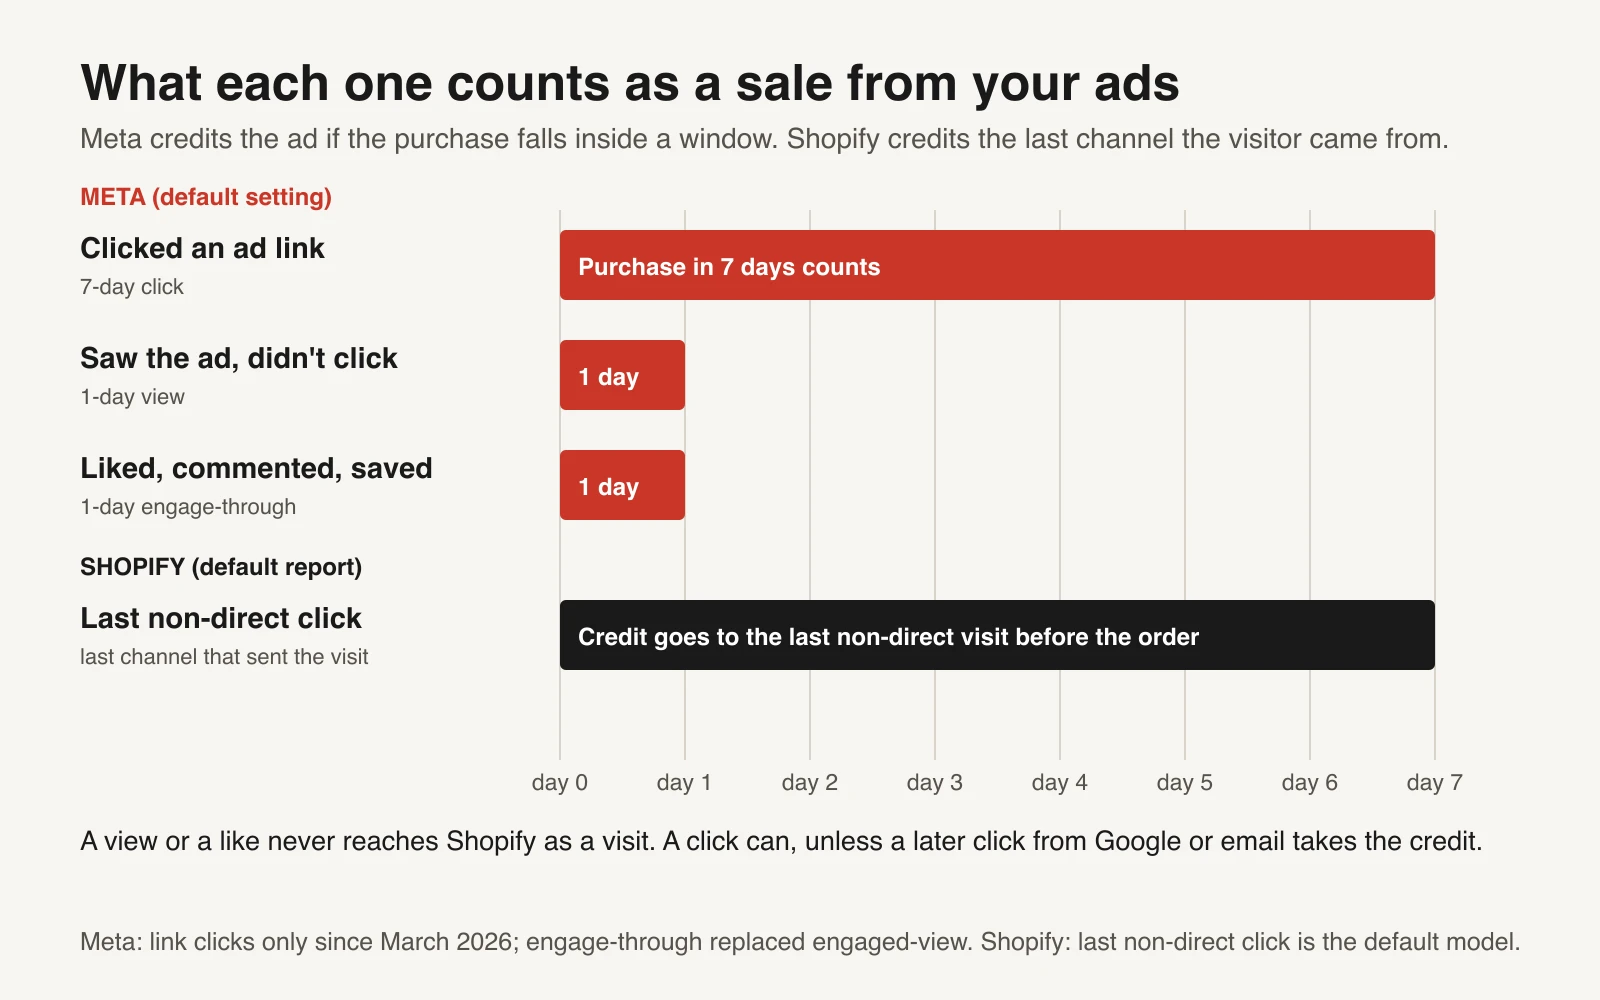
Meta counts inside windows. Shopify counts visits. The two overlap only where someone clicked an ad and that click was their last non-direct visit.
The six reasons the numbers differ
| # | Reason | Pushes Meta's number | How to see it |
|---|---|---|---|
| 1 | View-through. Someone saw the ad, didn't click, and bought within a day. Meta counts it; Shopify can't. | Up | Ads Manager → Columns → Compare attribution settings → 1-day view |
| 2 | Engage-through. Someone liked, commented on or shared the ad, then bought. No link click, so no visit reaches Shopify from the ad. | Up | Ads Manager: 1-day engage-through column |
| 3 | Duplicate purchase events. The browser pixel and the server (Conversions API) both report the purchase, and Meta can't tell they're the same. | Up | Events Manager purchases vs Shopify orders for the same days |
| 4 | A later click wins in Shopify. Someone clicked your Instagram ad, then came back through a Google search or an email and bought. Meta counts the ad click; Shopify credits Google or email. | Up | The Customer journey on Shopify's order page |
| 5 | Shopify can't link the visit. Clicked on a phone in the Instagram app, bought later on a laptop by typing your URL. Or the link lost its UTM tags. Shopify sees direct or unknown. | Up | Orders marked direct that Meta credits to a click |
| 6 | Meta misses some sales Shopify credits. The click was more than 7 days before the order, Meta couldn't match the buyer, or the visit came from an organic post with a tagged link. | Down | Shopify orders credited to Facebook/Instagram with no matching Meta purchase |
Two more reasons don't change the total but do move numbers between days and weeks:
- Which day a sale lands on. Meta's reporting can put a purchase on the day of the ad view or click rather than the day of the order. Meta's API documents this as a report-time setting: a person who saw the ad on 1 January and bought on 2 January shows on 1 January with impression-time reporting, and on 2 January with conversion-time reporting (Meta for Developers: Insights API). Shopify always uses the order date. Compare weeks, not single days.
- Time zones. If the ad account and the store use different time zones, late-night orders fall on different days.
And one that makes Meta's number partly an estimate: on iPhones, apps have to ask permission before tracking people across other companies' apps and websites (Apple). AppsFlyer reported that 50% of users globally consented as of April 2025 (AppsFlyer). When Meta can't observe a conversion directly, it uses statistical modelling for some metrics (Meta for Developers, 2020). Some of the 120 may be modelled, not observed.
Walking from 120 to 70
Here's the example store's week of 9 November, walked step by step. The first two steps come straight from Ads Manager columns. The rest are estimates, made by checking a sample of orders against the reasons above.
| Step | Purchases | Where the number comes from |
|---|---|---|
| Meta reports | 120 | Ads Manager, default attribution setting |
| − view-only (1-day view) | −30 | Ads Manager column |
| − engagement only (1-day engage-through) | −4 | Ads Manager column |
| − duplicate purchase events | −6 | Events Manager showed 6 more purchases than Shopify had orders on the days checked |
| − clicked the ad, a later click from another channel won | −14 | Estimate from a sample of order journeys |
| − clicked the ad, Shopify couldn't link the visit | −8 | Estimate: direct orders that Meta credits to a click |
| + Shopify credits Facebook/Instagram, Meta didn't count | +12 | Estimate: older clicks, unmatched buyers, organic posts |
| = Shopify orders credited to Facebook/Instagram | 70 | Shopify marketing report, last non-direct click |
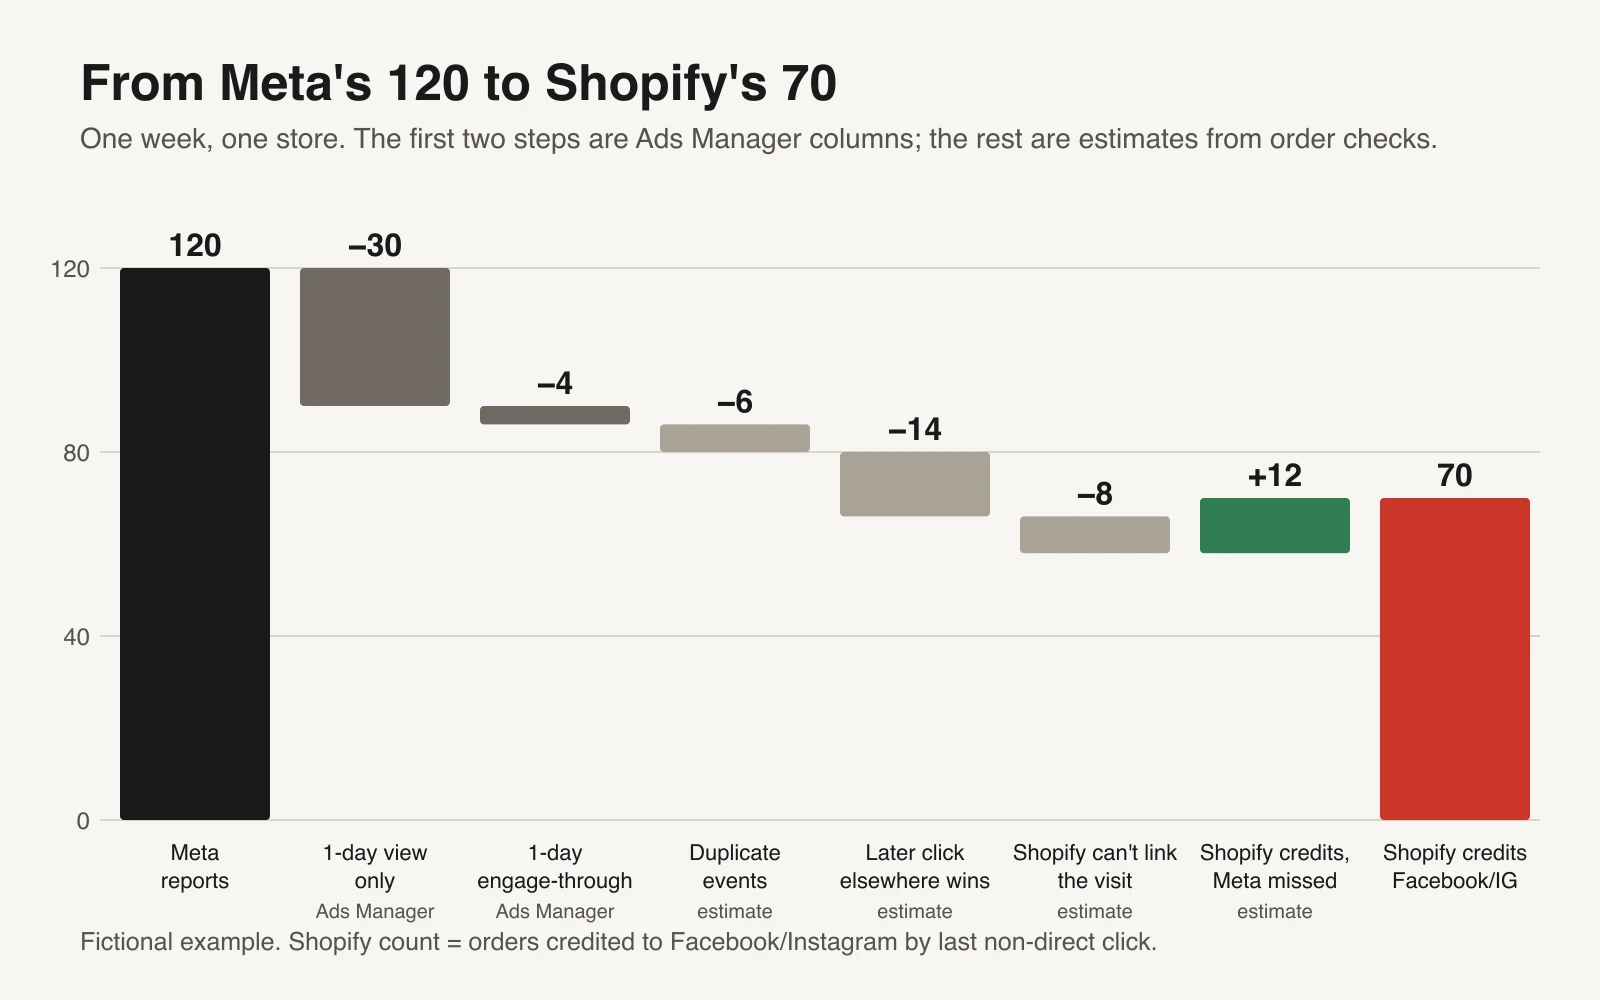
In this example, 34 of the 50-purchase gap come from two Ads Manager columns. You can check those in five minutes.
The point of the bridge isn't to land exactly on 70. It's to find out which reasons are big for your store. Three findings are worth acting on straight away:
- Duplicates are a bug. Fix them. Meta deduplicates pixel and Conversions API events only when both carry the same event ID and event name, and only within 48 hours of the first one; it doesn't deduplicate when you send from only one source (Meta for Developers: deduplication). The order number makes a good event ID. Our Conversions API deduplication audit walks through it.
- Lost links are a bug too. Every ad link needs UTM tags so Shopify can credit the visit.
- View-through is a choice, not a bug. Whether a 1-day view deserves credit is a real question with no free answer. See it, size it, and decide on purpose.
If the bridge leaves a big "unexplained" number, the problem is usually tracking: the workbook flags it.
Neither number is the truth
Meta's 120 includes people who would have bought anyway. Shopify's 70 misses people the ads persuaded who came back another way. The real number of sales your Meta ads caused is somewhere else, and neither dashboard can tell you exactly where.
That's fine, as long as you use each number for the job it can do.
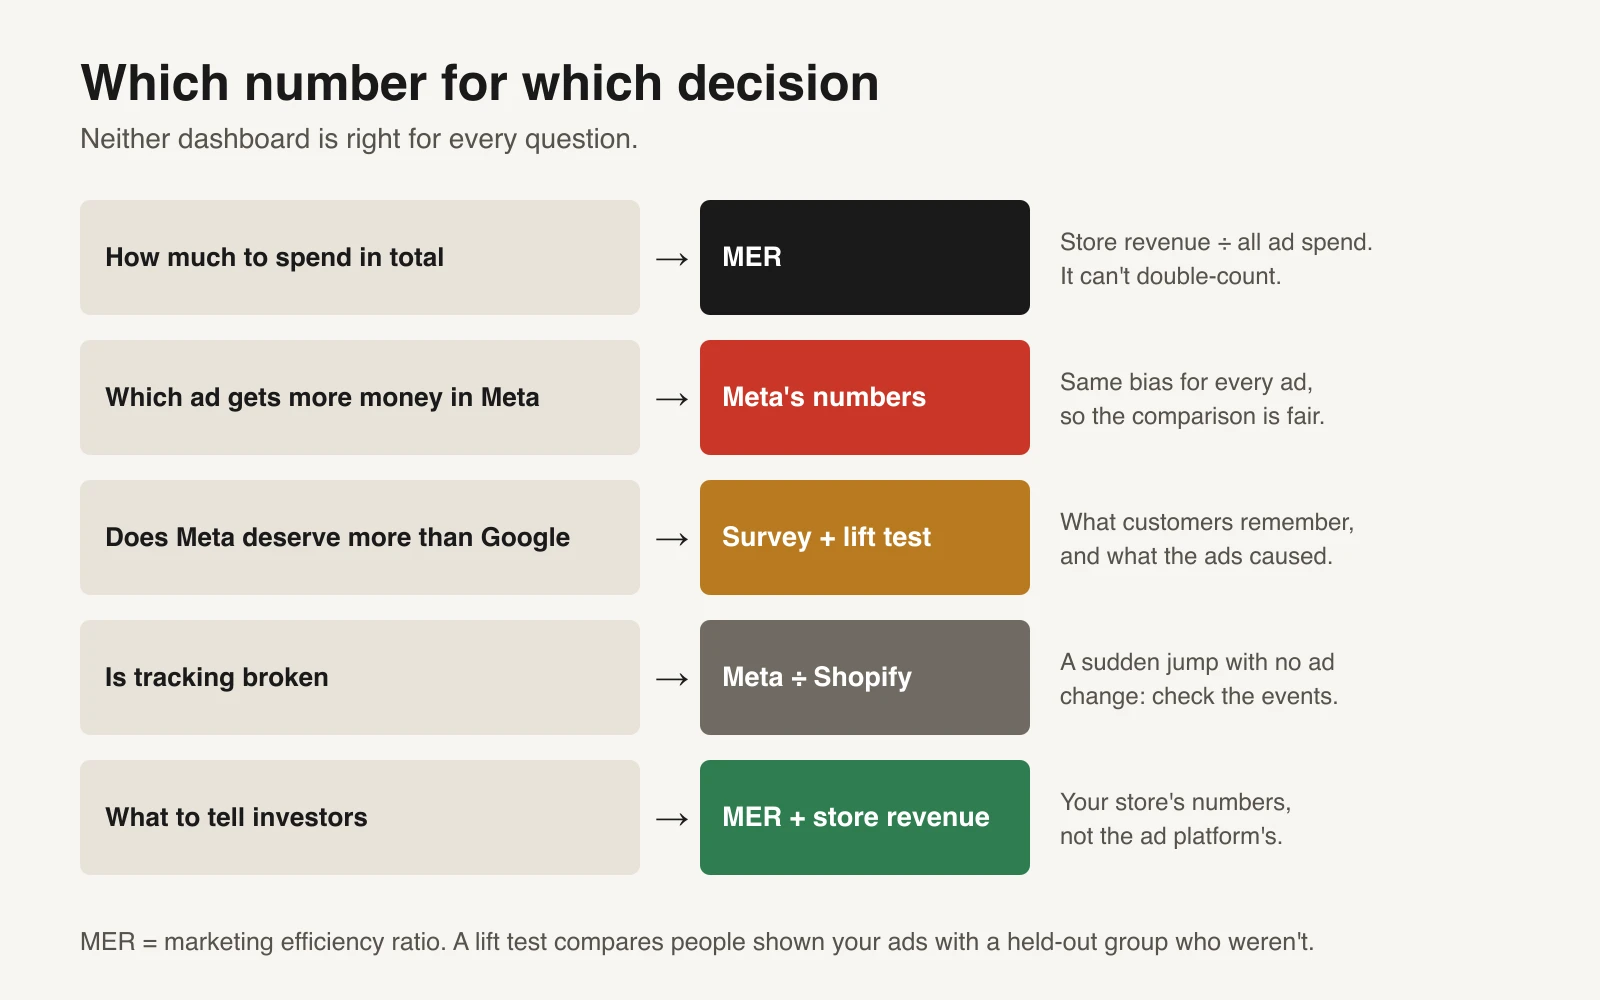
No single dashboard is right for every question.
For the total budget, use MER. Marketing efficiency ratio is total store revenue ÷ total ad spend, across every channel. It can't double-count, because it doesn't attribute anything. In the example week the store made $24,000 on $4,800 of total ad spend: an MER of 5.0. If Meta's ROAS rises while MER falls, Meta is claiming sales it didn't add. The MER calculator and our guide to MER versus platform ROAS cover it.
To compare ads inside Meta, use Meta's numbers. Every ad is measured with the same rules, so the comparison between ads is fair even when the total is generous. Keep one attribution setting; our guide to reconciling attribution windows explains why.
To judge whether Meta deserves more money, ask customers and run a test. Add a one-question survey to the thank-you page: "How did you first hear about us?", with Facebook and Instagram as separate options. In the example week, 180 of 300 buyers answered and 66 named Facebook or Instagram: 37% of answers, or about 110 orders if the people who didn't answer are similar. That's memory, not proof, but it's independent of both dashboards. Our post-purchase survey guide shows how to word it. For a bigger budget decision, a lift test, which compares people shown your ads with a held-out group who weren't, measures what the ads caused. Our guide to attribution versus incrementality explains when it's worth the cost.
Watch the trend, not the gap
A steady gap is normal. A sudden change in it is a signal.
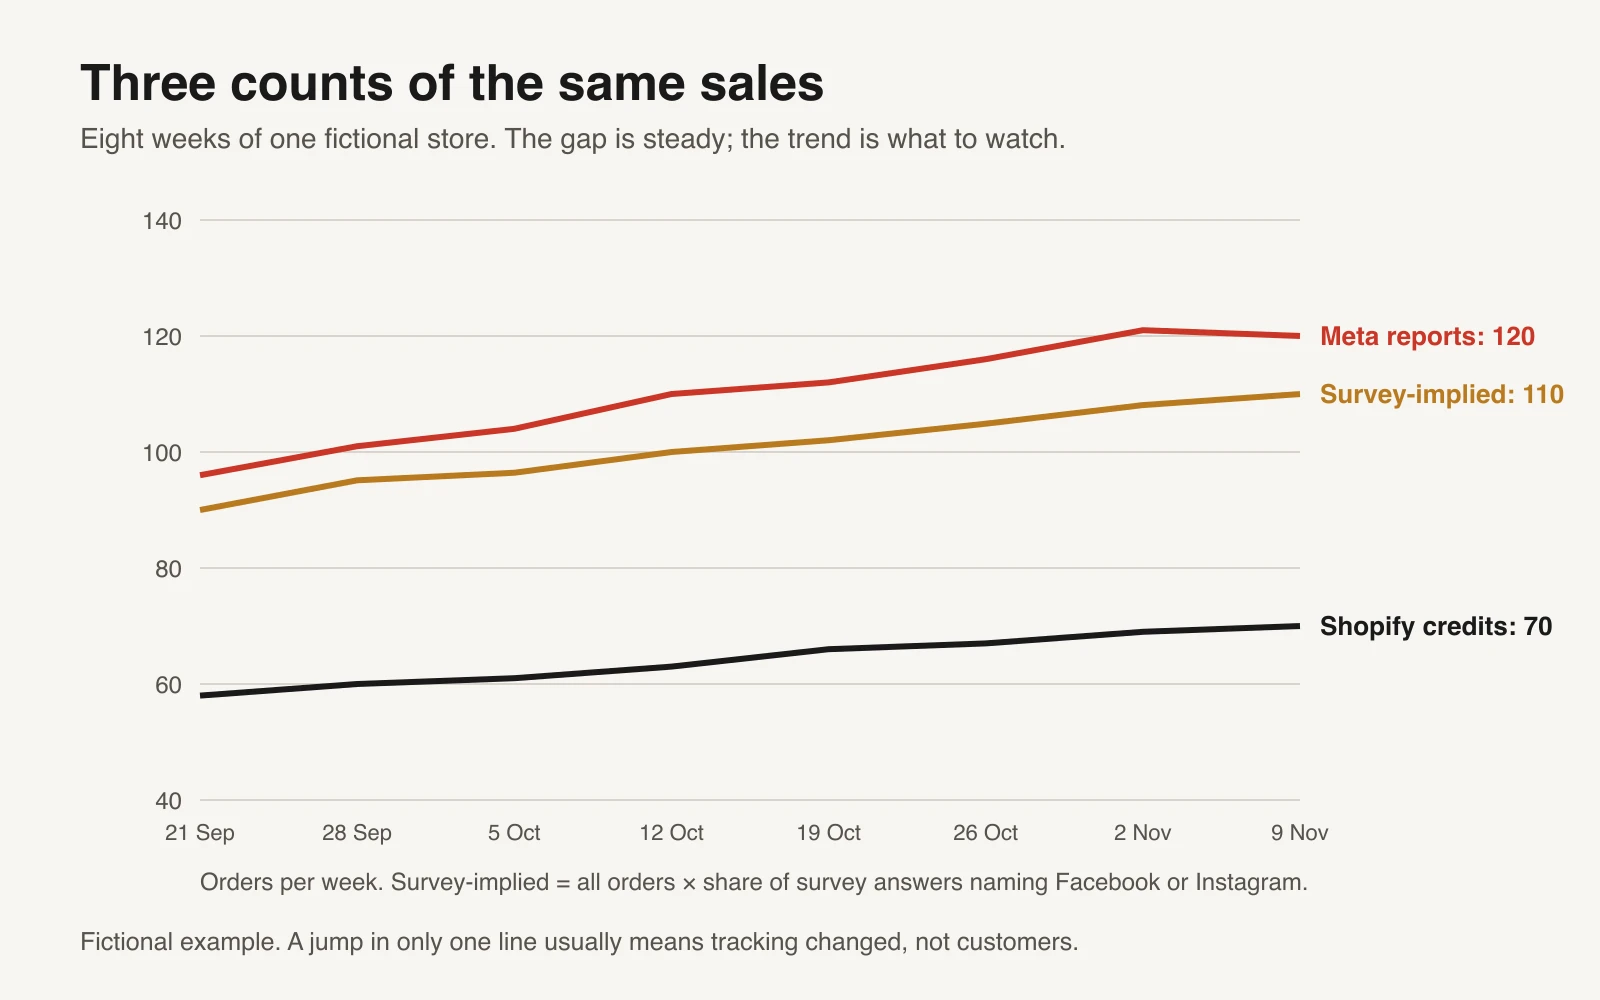
Three counts of the same sales. When they move together, the ads are working or not; when one jumps alone, something changed in tracking.
| What you see | Most likely cause | First check |
|---|---|---|
| Meta jumps, Shopify flat, MER flat | Duplicate events, or a new view-through-heavy campaign | Events Manager purchases vs Shopify orders; the view column |
| Shopify-credited drops, Meta flat | Broken UTMs or a changed link | Click an ad and check the landing URL |
| Meta counts more purchases than the store had orders | Duplicate or wrong events (for example, a purchase event on the cart page) | Test order in Events Manager's Test events |
| All three fall together | Real: the ads, the offer or demand changed | Your Monday ad report |
One more change to know about. From 12 January 2026, Meta's Ads Insights API stopped returning the 7-day view and 28-day view attribution windows (Meta for Developers). Combined with the March 2026 click change, reports pulled before and after those dates may not be comparable. Restart your trend line from a date you know the settings were stable.
Before you trust either number
- Same 7 days and the same time zone in Meta and Shopify
- Every ad link has utm_source, utm_medium and utm_campaign
- Pixel and Conversions API purchases share an event ID (the order number) and event name
- Events Manager purchases are not higher than Shopify orders for the same days
- Purchase value means the same thing in both (with or without tax and shipping)
- Test orders and draft orders excluded from Shopify's count
- Refunds treated the same on both sides: compare gross orders with gross orders
- Attribution setting written down, and the same for every week you compare
- Post-purchase survey live, with its response rate tracked
How to use the workbook
| Tab | What it does |
|---|---|
| Start here | Instructions, definitions and sources |
| Weekly log | One row a week: Meta spend and purchases split into click, view and engage-through, Shopify orders and revenue, Shopify-credited orders and survey answers. Works out Meta ROAS, Shopify-credited ROAS, MER, the Meta ÷ Shopify ratio, view share, survey-implied orders and a red / amber / green flag. Chart of the three counts. |
| Bridge | Pick a week; the first three steps fill themselves from the log. Add your estimates for the rest and it shows what's left unexplained, with a chart. |
| Tracking checks | Ten checks with a status, owner and notes for each |
| Decisions | Which number to use for which decision, and why |
Yellow cells with blue text are yours to change. Grey cells are formulas. The eight example weeks are fictional; overwrite them. "Shopify-credited ROAS" uses the store's average order value, so it's an estimate.
Tools that help
| Tool or repo | What it does | Who it's for |
|---|---|---|
| meta/facebook-python-business-sdk | Meta's official Python SDK for the Marketing API. Pull purchases by attribution setting into the weekly log automatically. | Anyone with a developer, or who's comfortable with a script |
| Shopify's marketing reports | Built in. Change the attribution model in a report to compare last non-direct click with other models. | Every Shopify store |
| A post-purchase survey app | Asks "How did you hear about us?" on the thank-you page. Several Shopify apps do this; pick one that exports answers by order. | Every store spending on ads |
Or let GaaS keep the books straight
GaaS is an AI agent that makes, launches and manages ads from three inputs: your website URL, a spend limit and a one-line goal. It reports against your store's revenue, not just the ad platform's count, and asks before anything spends. The method in this guide works the same either way.
What this can't tell you
- The true number of sales Meta caused. Only a controlled test gets close. The bridge explains the gap between two counts; it doesn't find the truth between them.
- Exact sizes for steps 4 to 6. They're estimates from samples. Say so when you share them.
- Anything about Google, TikTok or email. The same logic applies, with each platform's own windows. Add a column for each.
Sources checked 17 November 2026. Meta changes attribution settings and reporting often; check the linked pages before you rely on a specific window or date.