
Open Meta Ads Manager and you can add more than a hundred columns. Open Google Ads and there are dozens more. Most business owners either stare at all of them or look at none. Neither works.
This is the short version: one check and eight numbers, read in the same order every Monday morning, in about 15 minutes. Spend against budget first. Then MER, CAC and ROAS to see whether advertising is paying. Then hook rate, hold rate and CTR to see whether the ads themselves are working. Then frequency and CPM to see whether the audience is tired or the auction is getting more expensive.
For each number you get what it means in plain words, the formula, where to find it in Meta and Google, starting-point thresholds for green, amber and red, and what to do when it is off. The free workbook calculates all of it from one row of numbers a week.
This is a weekly check-in for the person who owns the budget. It is not the monthly report you send to a boss, client or investor; for that, use the paid-media reporting template, which adds scope definitions, attribution notes and incrementality evidence. All numbers in the worked example are fictional.
The 8 numbers at a glance
| # | Number | The question it answers | Formula | Starting point for "good" |
|---|---|---|---|---|
| 0 | Spend vs budget | Did the plan actually run? | Ad spend / planned budget | 90% to 110% |
| 1 | MER | Is advertising paying, across the whole business? | Total store revenue / total ad spend | At or above your target |
| 2 | CAC | What does a new customer cost? | Ad spend / new customers | At or below your target |
| 3 | ROAS | What do the ad platforms say they earned? | Platform-attributed revenue / platform spend | At or above your target |
| 4 | Hook rate | Does the opening stop the scroll? | 3-second video plays / video impressions | 30% or more |
| 5 | Hold rate | Do people keep watching? | ThruPlays / 3-second video plays | 25% or more |
| 6 | CTR | Do people click through? | Link clicks / impressions | 1.0% or more (Meta prospecting) |
| 7 | Frequency | Are the same people seeing it too often? | Impressions / reach | 2.0 or less per week (prospecting) |
| 8 | CPM | Is attention getting more expensive? | Spend / impressions x 1,000 | Within +10% of your 4-week average |
The thresholds are starting points written by GaaS editorial, not industry benchmarks. Every account, country and category is different. Use these for the first 8 to 12 weeks, then replace them with ranges from your own history (there's a simple method near the end).
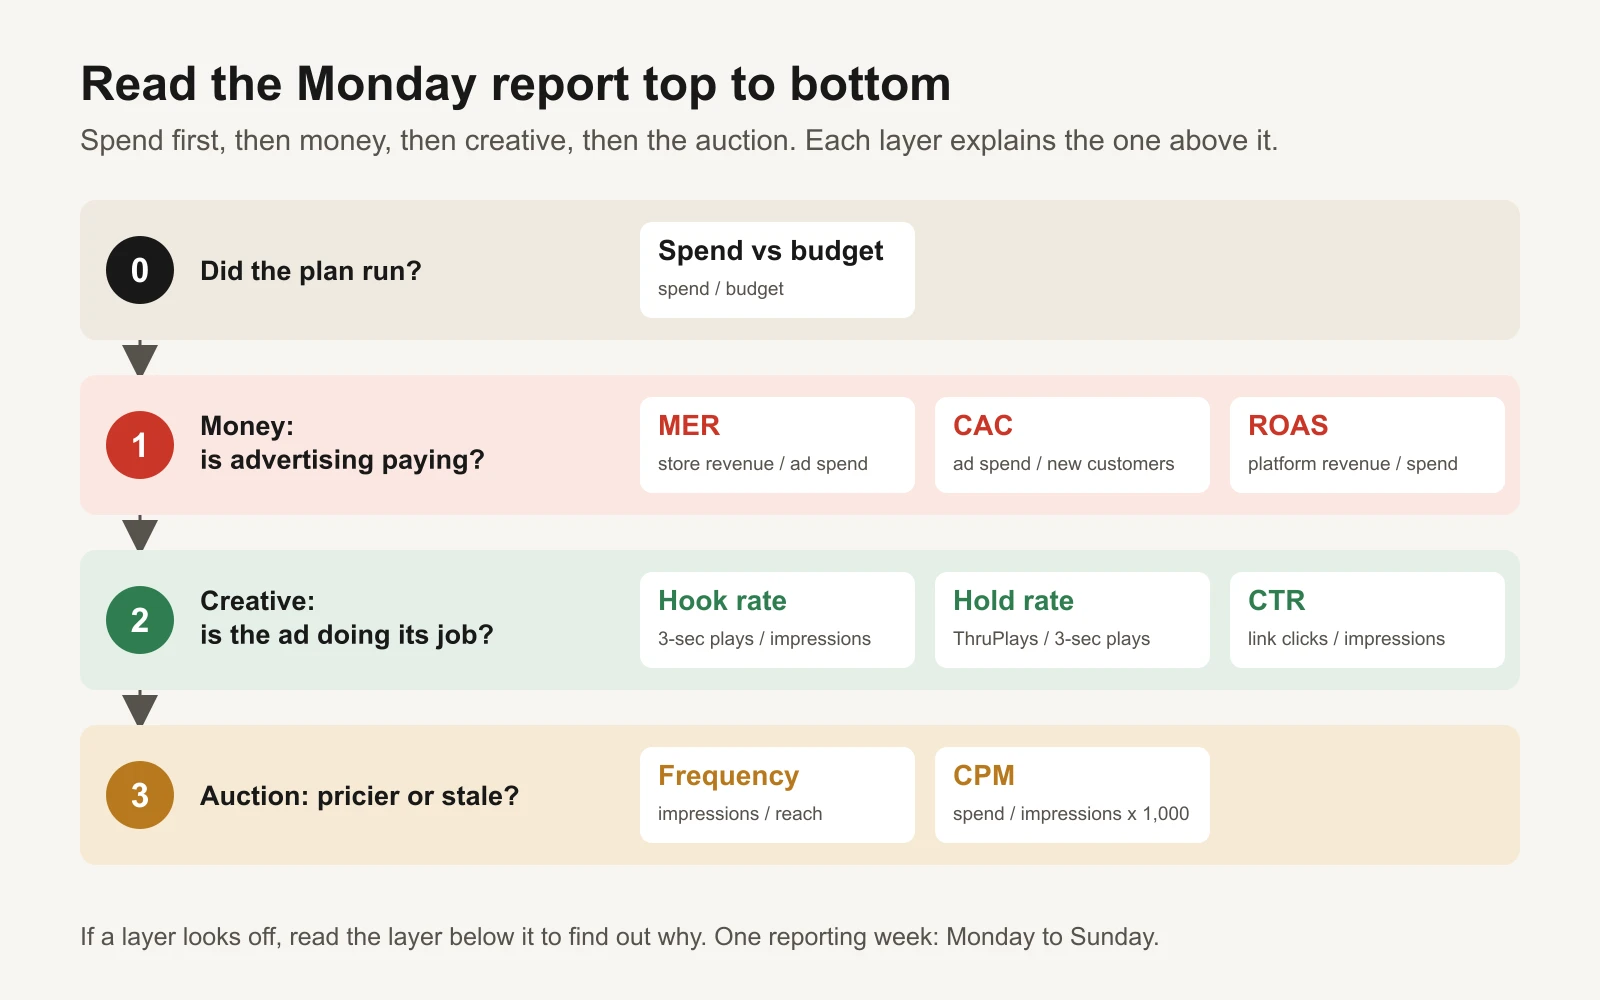
Read top to bottom. When a layer looks off, the layer below it usually explains why.
Before the 8: did you spend what you planned?
In plain words: if you meant to spend $7,000 last week and spent $9,500, or $3,000, every other number is describing a different week from the one you planned.
How to calculate it: total ad spend across platforms divided by the budget you planned for the week. $7,350 / $7,000 = 105%.
Where to find it: Meta Ads Manager, account level, Amount spent column with last Monday to Sunday as the date range. Google Ads, Campaigns view, Cost column, same dates.
Starting points: good 90% to 110%; watch 80% to 90% or 110% to 120%; bad under 80% or over 120%.
Why a week can drift on its own: both platforms move spend between days on purpose. Meta may spend up to 75% over a daily budget on a strong day but no more than 7 times the daily budget over its Sunday-to-Saturday week (Meta: About daily budgets). Google may spend up to twice the average daily budget on a single day and no more than 30.4 times it in a month (Google Ads: overdelivery). Note that Meta's budget week starts on Sunday, so a Monday-to-Sunday report won't line up with it exactly. That is fine; just be consistent.
What to do when it's off:
- Over budget: look for budget edits, new campaigns someone launched, or a change from a daily to a lifetime budget. If it was a mistake, fix it today.
- Under budget: look for rejected ads, payment failures, ad sets marked "Learning limited", cost or bid caps set too tight, and audiences that are too small.
- Don't double budgets to "catch up" on an underspent week. That is a big budget change made for the wrong reason.
1. MER: is advertising paying across the whole business?
In plain words: MER stands for marketing efficiency ratio. For every $1 you spent on ads, how many dollars of total sales came in, from every channel. It doesn't rely on any platform's tracking, so it is the most honest top-line number you have.
How to calculate it: total store revenue for the week divided by total ad spend on every platform. $17,272 / $7,350 = 2.35.
Where to find it: not in Meta or Google. Take revenue from your store (for example Shopify Analytics, total sales for the week) and spend from every ad platform you use. The free MER calculator does the sum.
Starting points: good at or above your target MER; watch between break-even and target; bad below break-even. Break-even MER is 1 divided by your contribution margin (revenue minus product cost, shipping, fees and other per-order costs, as a share of revenue). At a 50% contribution margin, break-even MER is 2.0.
What to do when it's off: split the change in two. Did revenue fall (a site problem, stock running out, no email sent this week, a slow season), or did spend rise? Then read ROAS and the creative numbers below to find where. Don't judge one week alone; compare it with the previous four. Holidays and promotions move MER for reasons that have nothing to do with ads. The MER vs platform ROAS guide covers how to budget with it.
2. CAC: what does a new customer cost?
In plain words: CAC is customer acquisition cost. How much ad spend it took to win one new customer, someone who had never bought from you before.
How to calculate it: total ad spend divided by first-time customers that week. $7,350 / 134 = $54.85.
Where to find it: spend from Meta and Google; the count of first-time customers from your store's customer report. Platform "cost per purchase" is not CAC, because it includes returning customers.
Starting points: good at or below your target CAC; watch between target and your maximum; bad above your maximum. Your maximum is what a new customer is worth to you in contribution over the time period you choose (first order only, or 90 days, or a year).
What to do when it's off: if CAC rises while MER holds steady, more of your sales are coming from returning customers; that may be fine. If CAC rises and MER falls, acquisition is getting harder: look at prospecting creative, the audience and the first-order offer. Don't raise the budget to "fix" CAC. The new-customer vs blended CAC guide explains the two versions.
3. ROAS: what do the platforms say they earned?
In plain words: ROAS is return on ad spend, as the ad platforms report it: the revenue each platform credits to its own ads for every $1 spent there.
How to calculate it: platform-attributed revenue divided by spend on that platform. In the workbook, Meta and Google are combined: ($11,413 + $3,434) / ($5,650 + $1,700) = 2.02.
Where to find it: Meta Ads Manager, the Purchase ROAS column (or purchases conversion value divided by amount spent). Google Ads, the Conv. value / cost column.
Starting points: good at or above your target ROAS; watch between break-even and target; bad below break-even.
What to do when it's off: platforms decide how much credit to take, and two platforms can both claim the same sale. So:
- ROAS falling while MER holds: check tracking first. Is the pixel firing? Is the Conversions API still sending purchases? Did someone change the attribution setting? Only then cut spend.
- ROAS rising while MER is flat: the platforms may be crediting themselves for sales that would have happened anyway.
- Never add up ROAS across platforms and treat the total as real revenue.
4. Hook rate: does the opening stop the scroll?
In plain words: out of every 100 times your video ad was shown, how many people watched at least 3 seconds. It grades your first frame and your first line.
How to calculate it: 3-second video plays divided by impressions of video ads. Use video-ad impressions only, or photo ads will drag the number down. 45,042 / 237,063 = 19%.
Where to find it: Meta Ads Manager, the 3-second video plays and Impressions columns. Meta counts a 3-second play when the video plays for at least 3 seconds (or nearly all of a shorter video), and it doesn't count replays (Meta: 3-second video plays). Meta also offers a ready-made "3-second video plays rate per impressions" column; calculating it yourself keeps the definition clear. Google has no exact match; on YouTube video campaigns the nearest columns are video played to 25% and view rate.
Starting points: good 30% or more; watch 20% to 30%; bad under 20%.
What to do when it's off: make new openings for the same video: a new first frame, a new first line, new on-screen text. Test three hooks on one body so you learn which opening works. Don't rebuild the whole video when only the first three seconds are weak. For 50 hook patterns, see the ad formats teardown.
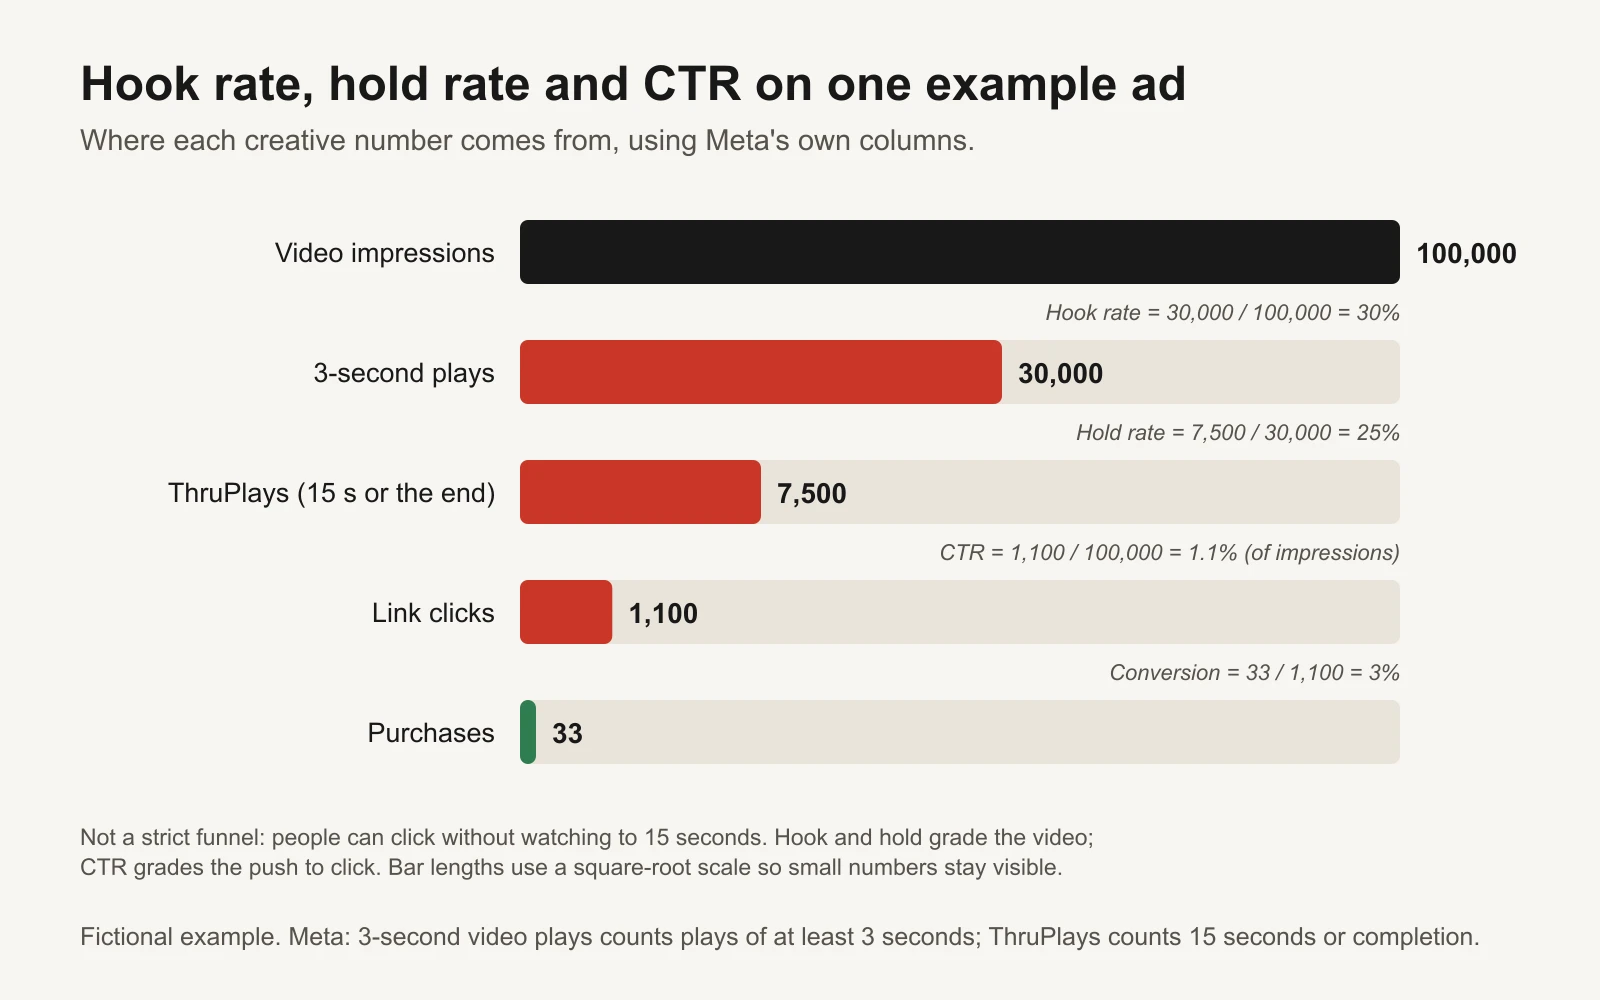
Hook and hold grade the video. CTR grades the push to click. It isn't a strict funnel: people can click before 15 seconds.
5. Hold rate: do people keep watching?
In plain words: of the people you hooked, how many kept watching to the 15-second mark, or to the end of a shorter video.
How to calculate it: ThruPlays divided by 3-second video plays. 10,810 / 45,042 = 24%.
Where to find it: Meta Ads Manager, the ThruPlays column. Meta counts a ThruPlay when a video plays to completion or for at least 15 seconds (Meta: ThruPlays). On Google video campaigns, use video played to 50%, 75% and 100%.
Starting points: good 25% or more; watch 15% to 25%; bad under 15%. Some marketers use 6-second plays or 25% watched instead of ThruPlays. Any of them works if you use the same one every week.
What to do when it's off: a strong hook with a weak hold means the video doesn't pay off its opening. Cut the slow intro, show the product sooner, and change the picture every 2 to 3 seconds. Don't make the video longer.
6. CTR: do people click through?
In plain words: CTR is click-through rate. Of every 100 impressions, how many people clicked through to your website.
How to calculate it: link clicks divided by impressions. 3,240 / 395,105 = 0.82%.
Where to find it: Meta Ads Manager, the CTR (link click-through rate) column, which Meta calculates as link clicks divided by impressions (Meta: CTR (link)). Use the link version, not "CTR (all)", which counts every click including likes and profile taps. Google Ads, the CTR column.
Starting points for Meta prospecting: good 1.0% or more; watch 0.6% to 1.0%; bad under 0.6%. Search ads usually run much higher because people are already looking for you; give them separate thresholds.
What to do when it's off: low CTR with a good hold rate means people watched but weren't told clearly what to do or why now: make the offer and the call to action plainer. High CTR but few sales points to the landing page: does it match what the ad promised?
7. Frequency: are people seeing your ads too often?
In plain words: the average number of times each person saw your ads during the week.
How to calculate it: impressions divided by reach. 395,105 / 109,751 = 3.6.
Where to find it: Meta Ads Manager, the Frequency column, which Meta calculates as impressions divided by reach (Meta: Frequency). Take it for exactly the 7 days you are reporting; reach doesn't add up across weeks, so four weekly frequencies don't make a monthly one. In Google Ads, an average impression frequency per user is available for some campaign types, such as video and Display.
Starting points for prospecting: good 2.0 or less; watch 2.0 to 3.5; bad over 3.5. Retargeting runs higher by design.
What to do when it's off: rising frequency together with a falling hook rate or CTR is the classic sign of creative fatigue. Add new creative concepts and give delivery a wider audience. Don't push more budget into the same people. The frequency and fatigue diagnosis guide goes deeper.
8. CPM: is attention getting more expensive?
In plain words: CPM is cost per 1,000 impressions: the price you pay for attention in the ad auction.
How to calculate it: spend divided by impressions, times 1,000. $5,650 / 395,105 x 1,000 = $14.30. Then compare it with the average of the previous four weeks: +11.5%.
Where to find it: Meta Ads Manager, the CPM (cost per 1,000 impressions) column (Meta: CPM). Google Ads, the Avg. CPM column.
Starting points: compared with your previous 4-week average, good up to +10%; watch +10% to +25%; bad over +25%.
What to do when it's off: CPMs rise for everyone in Q4 and on big sale days, so compare with the same weeks last year before reacting. If CPM rises while CTR falls, weaker creative may be part of the cause, because ads people ignore tend to cost more to deliver. The CPM spike investigation guide has a step-by-step check.
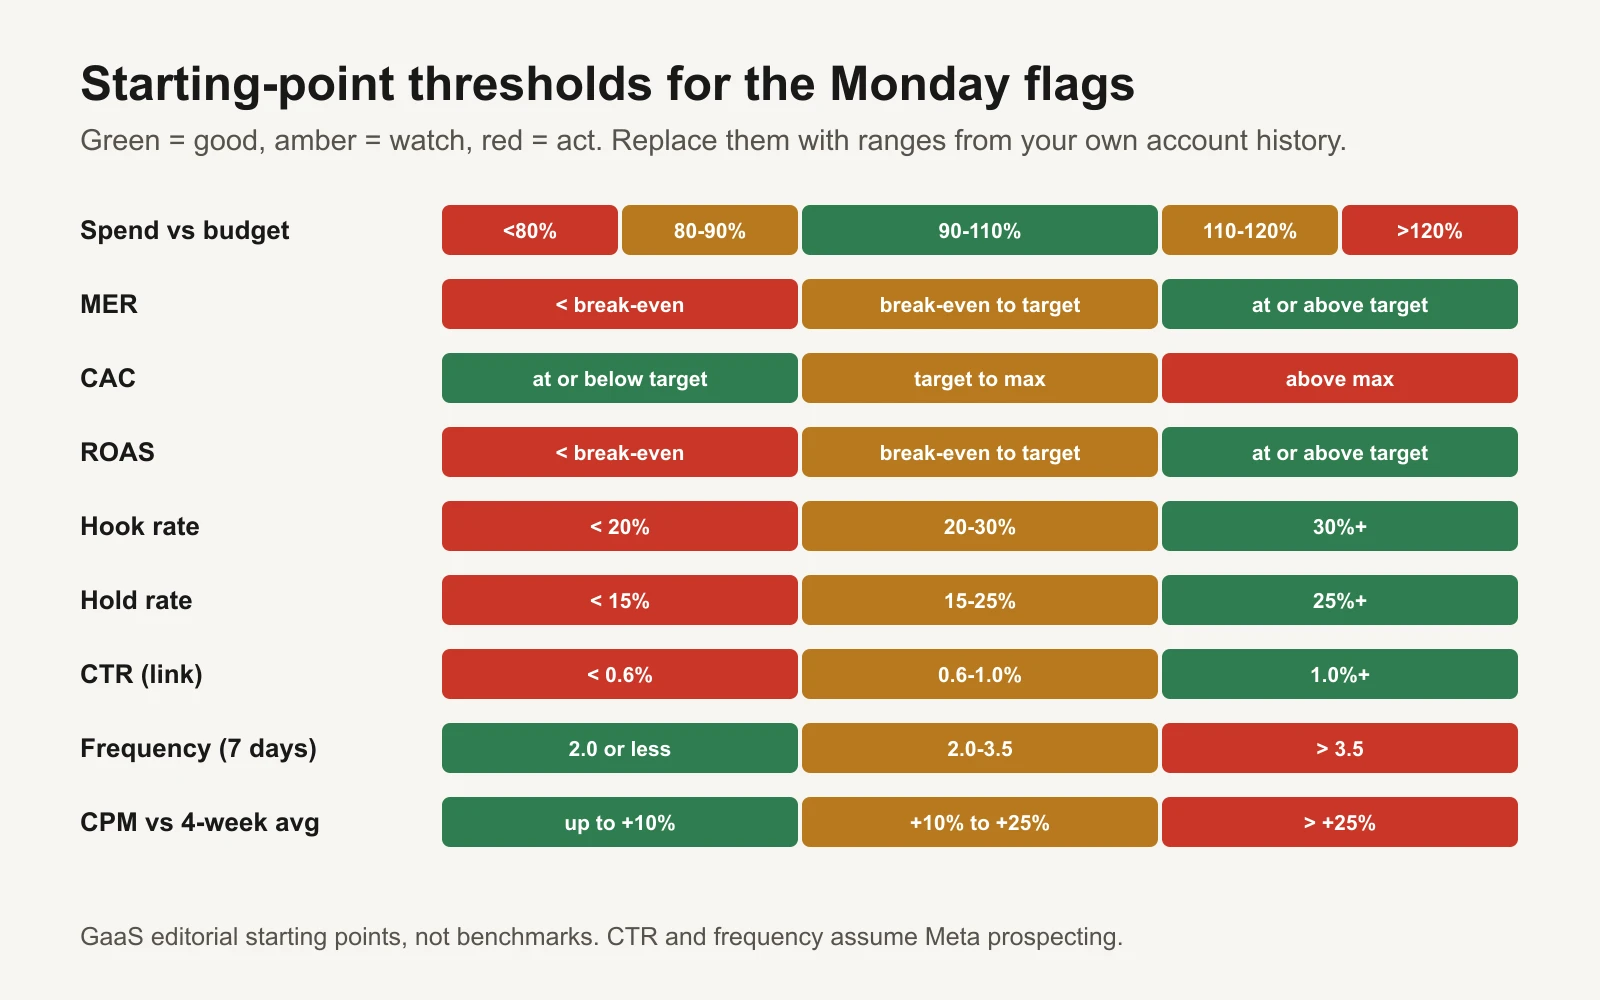
Every threshold is editable on the workbook's Settings tab.
A worked Monday: reading week 12 in two minutes
Here is a fictional online store selling coffee gear, reviewing the week of 2 to 8 November 2026. It has a 50% contribution margin (break-even MER 2.0), a target MER of 2.8, a target platform ROAS of 2.5 and a target CAC of $45 with a $60 maximum.
| Number | Last week | This week | Change | Flag |
|---|---|---|---|---|
| Spend vs budget | 104% | 105% | +1% | Good |
| MER | 2.75 | 2.35 | -15% | Watch |
| CAC | $47.08 | $54.85 | +17% | Watch |
| ROAS | 2.30 | 2.02 | -12% | Watch |
| Hook rate | 23.0% | 19.0% | -17% | Bad |
| Hold rate | 26.0% | 24.0% | -8% | Watch |
| CTR | 0.95% | 0.82% | -14% | Watch |
| Frequency | 2.9 | 3.6 | +24% | Bad |
| CPM | $13.40 | $14.30 | +7% (+11.5% vs 4-week average) | Watch |
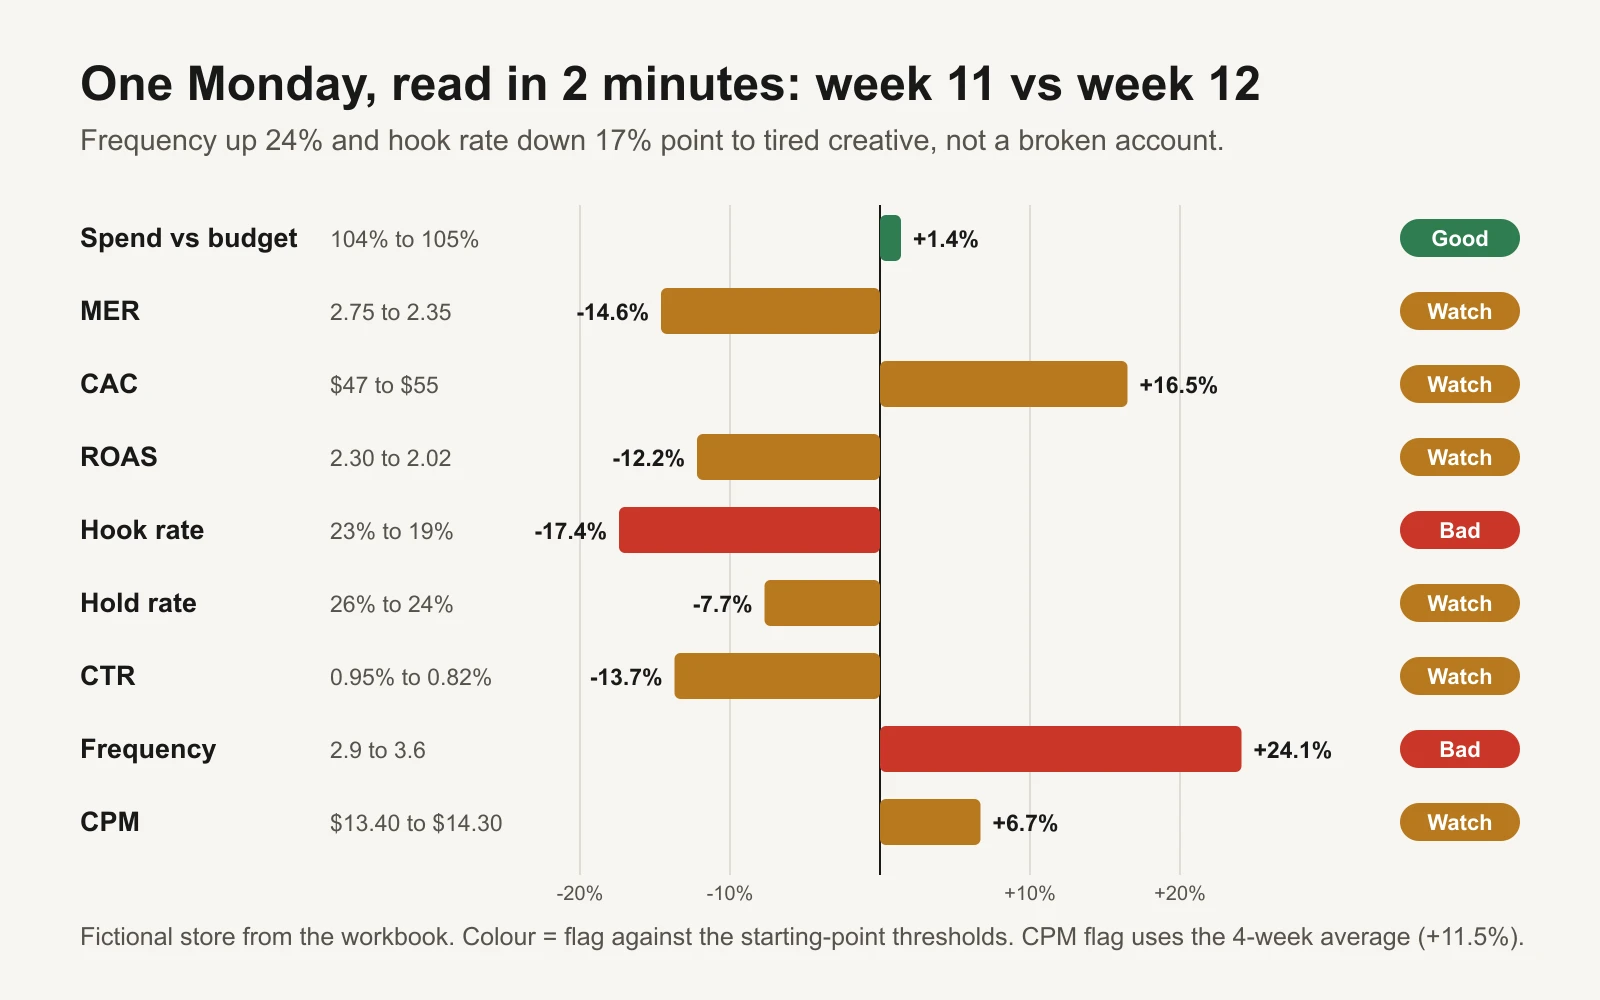
Two red rows and they point the same way: tired creative.
Reading it top to bottom:
- Spend: 105% of budget. The plan ran. Move on.
- Money: MER fell to 2.35 and CAC rose to $55. Still above break-even, but below target for a second week. Something changed; find out what.
- Platforms: ROAS fell too, in line with MER. So this is unlikely to be a tracking problem; real sales per ad dollar fell.
- Creative: hook rate fell to 19% (red), with hold and CTR also down. Fewer people are stopping, and fewer of those are clicking.
- Auction: frequency jumped to 3.6 (red). CPM is up a little, but not enough to explain a 15% MER drop.
The notes column in the log says the same four ads are in their sixth week. Put together: the same people are seeing the same ads too often, they've stopped paying attention, and efficiency is sliding. The action is new hooks and new creative concepts for prospecting this week. Not a budget cut, and not an attribution change.
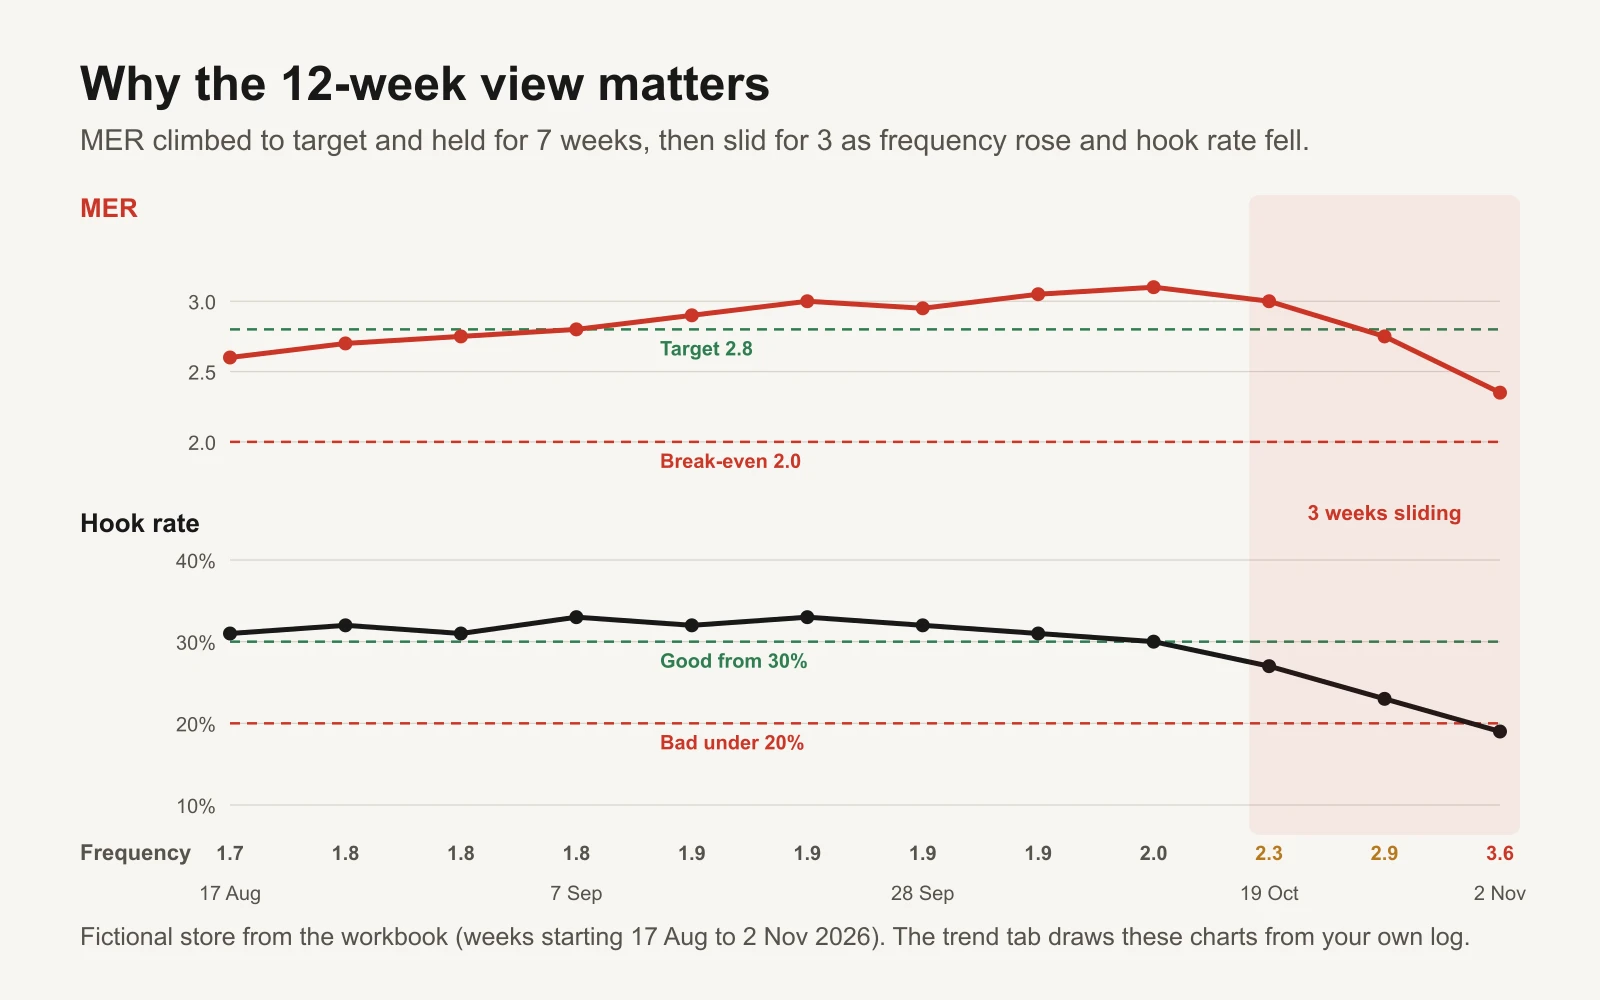
The 12-week view shows a three-week slide, not a one-week blip. That is what justifies acting now.
The "what to do" lookup: patterns across numbers
Single numbers tell you something is off. Combinations usually tell you why. These are the patterns we see most often in weekly reviews.
| What you see | What it usually means | Check first | Do this |
|---|---|---|---|
| Frequency up, hook rate and CTR down | Creative fatigue | How long the top ads have run | New hooks and new concepts; wider audience |
| ROAS down, MER steady | Tracking or attribution change | Pixel and Conversions API health; attribution setting | Fix tracking before touching budgets |
| MER down, ROAS steady | Fewer sales from other channels (email, organic) | Email sends, site traffic, stock | Fix the non-ad cause; don't cut ads for it |
| CPM up, CTR steady, season is Q4 | Normal seasonal competition | Same weeks last year | Plan for it; make sure your offer can absorb it |
| CPM up and CTR down | Weaker creative plus pricier auction | Hook rate and hold rate trend | Refresh creative first |
| Hook rate good, hold rate bad | Video doesn't pay off its opening | Where viewers drop off | Re-edit: cut the intro, show the product sooner |
| CTR good, sales low | Landing page doesn't match the ad | The page on a phone; price and offer shown | Match the page to the ad's promise |
| CAC up, MER steady | More sales from returning customers | New vs returning split | Fine if planned; test a first-order offer if not |
| Spend well under budget | Delivery blocked | Rejections, payments, learning limited, caps | Fix the block; don't double budgets to catch up |
The workbook has a longer version of this table, one row per number and flag, and the Monday report tab looks up the right row automatically.
Set up the routine once, then it takes 15 minutes
- Save a column preset in Meta Ads Manager. Add these columns: Amount spent, Impressions, Reach, Frequency, Link clicks, CTR (link click-through rate), CPM, 3-second video plays, ThruPlays, Purchases, Purchases conversion value and Purchase ROAS. Save it as "Monday report".
- Save a Google Ads view. Campaigns, with Cost, Impr., Clicks, CTR, Avg. CPM, Conversions, Conv. value and Conv. value / cost.
- Find two numbers in your store: total sales for last week and the number of first-time customers.
- Every Monday: set the date range to last Monday to Sunday, copy the numbers into one new row of the workbook's Weekly log, and add one line in "What changed this week" (new ads, a sale, a budget change, a site issue).
- Read the Monday report tab top to bottom. Act on red, note amber, glance at the 12-week trend before any big change.
A weekly cadence is long enough to smooth out day-of-week swings and short enough to catch a problem before it costs a month. If you also run an AI agent on your account, the weekly review for an AI ad agent covers what to check on top of these numbers.
Set your own thresholds after 8 to 12 weeks
Starting points are a crutch. Once you have 8 to 12 weeks in the log, replace them:
- For numbers where higher is better (hook rate, hold rate, CTR): set "good" at about your median week and "bad" at about your worst two or three weeks. Your median is the middle value when you sort the weeks.
- For numbers where lower is better (frequency, CPM change): do the reverse.
- For money numbers (MER, CAC, ROAS): keep them tied to your margin and targets, not to history. Break-even doesn't change because last quarter was good.
- Revisit each quarter, and expect Q4 to look different from Q2.
How this differs from a monthly report
The Monday report is for deciding what to do this week. A monthly report is for explaining results to someone else: it needs written definitions, attribution windows, a reconciliation between platform and store numbers, and any incrementality evidence. Use both. The paid-media reporting template is built for the monthly one, and the client report narrative guide helps if you report to clients.
Tools and repos for automating the Monday pull
| Tool or repo | What it is for | Who should use it |
|---|---|---|
| meta/facebook-python-business-sdk | Official Python SDK for Meta's Marketing API: pull last week's insights (spend, impressions, reach, video plays) in a script | Anyone comfortable with a little Python |
| googleads/google-ads-python | Official Google Ads API client library for Python: query cost, clicks, conversions and CPM | Teams automating the Google side |
| googleads/google-ads-mcp | Google's MCP server, which lets an AI assistant query Google Ads with GAQL; write tools need a propose-then-confirm step | Owners who want to ask an assistant for last week's numbers |
| pipeboard-co/meta-ads-mcp | Third-party MCP server for Meta Ads, including an insights tool | Marketers who want an assistant to pull Meta numbers; grant read-only access where you can |
| googleanalytics/google-analytics-mcp | Google's MCP server for Google Analytics data | Stores that track revenue and new users in GA4 |
| n8n-io/n8n | Open-source workflow automation: schedule a Monday 7 a.m. job that pulls the numbers into a sheet | Owners who want the log filled before they wake up |
| evidence-dev/evidence | Build reports from SQL and markdown | Teams that keep ad data in a database |
| metabase/metabase | Open-source dashboards anyone can click through | Teams that want a shared dashboard instead of a spreadsheet |
| facebookexperimental/Robyn and google/meridian | Open-source marketing mix modelling from Meta and Google | Larger advertisers ready to go beyond MER to model each channel's contribution |
| anthropics/skills | Public agent skills, including an xlsx skill for reading and editing spreadsheets | Anyone who wants an assistant to fill in or extend this workbook |
Or let GaaS watch the numbers
GaaS is an AI agent that creates, launches and optimizes Meta and Google ads from your website, a spend limit and a one-line goal. It reads numbers like these every day, proposes the next change in plain words, and nothing spends without your approval. If you'd rather review a weekly summary than build one, see how GaaS works. The workbook is yours either way.