
Meta will never tell you which sales it didn't drive. Your customers will, in one tap.
Ads Manager reports the purchases Meta can connect to an ad in its attribution window. By default that is a click in the last 7 days, an engagement in the last day, or a view in the last day (Jon Loomer: Meta ads attribution in 2026). Someone who scrolled past your ad yesterday and bought today because their sister told them about you counts as a Meta sale. There is no report in Ads Manager of the sales Meta didn't influence.
A one-question survey on your order confirmation page is the cheapest second opinion you can get. This guide gives you the question and the answer options, shows how to put it on Shopify's upgraded Thank you page, and walks through a free sheet that lines the answers up against Meta's numbers, month after month.
The workbook has a Survey kit tab (question, options and setup rules), an Answers tab where you paste each month's export, a Mapping tab that turns answers into channels, a Compare tab with the said-to-reported ratio per channel, and a Monthly tab that charts the ratio over time. Example numbers in this article and the workbook are a fictional worked example unless a source is linked.
If you want the research side (how to word survey questions, non-response and memory bias), our earlier guide on using post-purchase surveys alongside attribution covers it. This one is the practical kit and the comparison sheet.
The worked example: Meta says 612, customers say 341
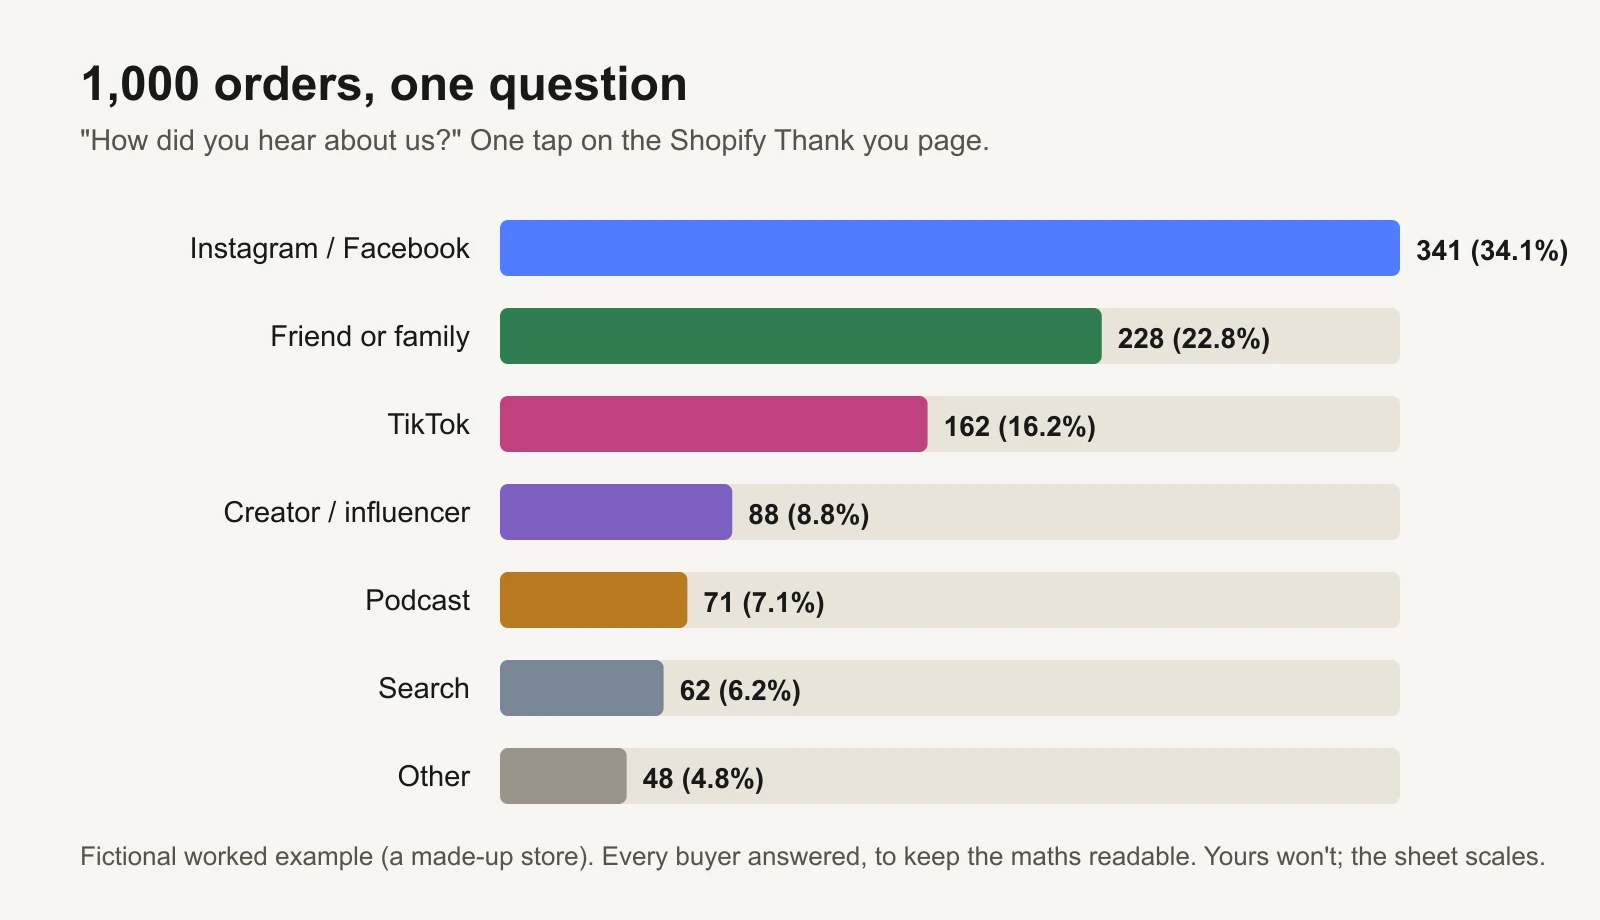
Fictional worked example (a made-up store). Every buyer answered, to keep the maths readable.
A fictional store had 1,000 orders in October. To keep the maths simple, every buyer answered the question; in real life many won't, and the sheet scales for that. For the same dates, with Meta's default attribution setting, Ads Manager reported 612 purchases.
341 buyers said Instagram or Facebook.
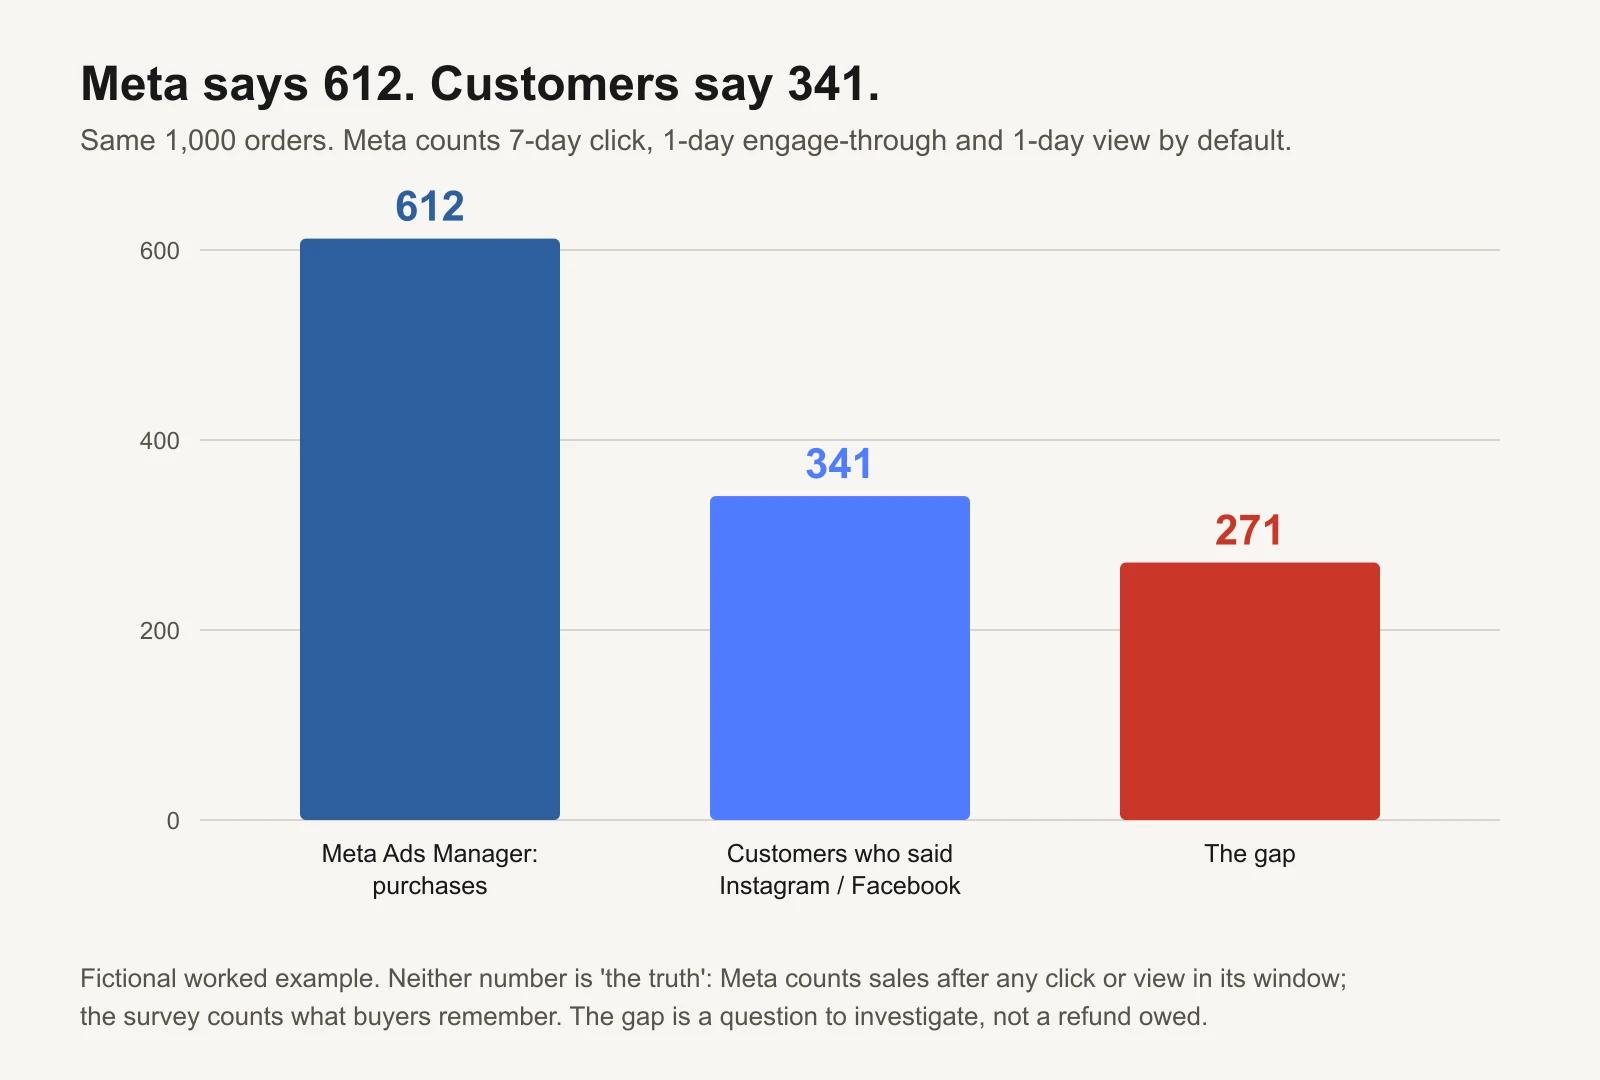
Fictional worked example. The gap is a question to investigate, not a refund owed.
So who are the other 271? Some honest answers, none of which make either number wrong:
- View-through and engage-through sales. Meta counts a purchase a day after someone saw or engaged with an ad, even if they never clicked. Some of those buyers came because of the ad. Many would have bought anyway.
- Overlap. One buyer can see a TikTok, hear a podcast and then see a Meta ad. Meta counts the sale. The buyer names whichever they remember first.
- Memory. People forget where they first saw a brand, and "friend or family" is often where an ad started. Some of the 228 friend referrals began with a Meta ad someone else saw.
- Modelled conversions. Meta fills some gaps from people it can't track with modelling, which a survey can't see.
What you do with the gap is the point of the sheet. In this example, Meta reports a cost per purchase of $29.41 on $18,000 of spend. Using the survey instead (341 orders), it's $52.79. The truth is somewhere in between, and you can only find out where with a test (see attribution vs incrementality). But you now know Meta's count is 1.8 times what buyers remember, and you can watch whether that ratio holds.
The question and the options
Copy this. The workbook's Survey kit tab has it with the reason for each line.
Question: How did you hear about us?
Options (in random order, except Other):
- Instagram / Facebook
- TikTok
- Friend or family
- Creator / influencer
- Podcast
- Search (Google, Bing…)
- Other (please tell us), with a text box
Why it's built this way:
- One question, one tap, optional. Every extra question cuts how many people answer. Forcing an answer adds noise: people tap anything to get past it.
- One option for Instagram and Facebook. Buyers don't separate Meta's apps, so two options make it a coin toss.
- "Friend or family" is not optional. Without it, people pick the nearest ad channel and your paid channels look better than they are.
- List every channel you pay for, by the name buyers use. Drop "Podcast" if you've never been on one.
- Randomise the order. The first option gets picked more just for being first. Keep "Other" last.
- Read the "Other" answers monthly. If one keeps coming up (a retailer, a newsletter), add it as an option.
- Don't change the wording. If you do, start a new trend line.
Putting it on Shopify's new Thank you page
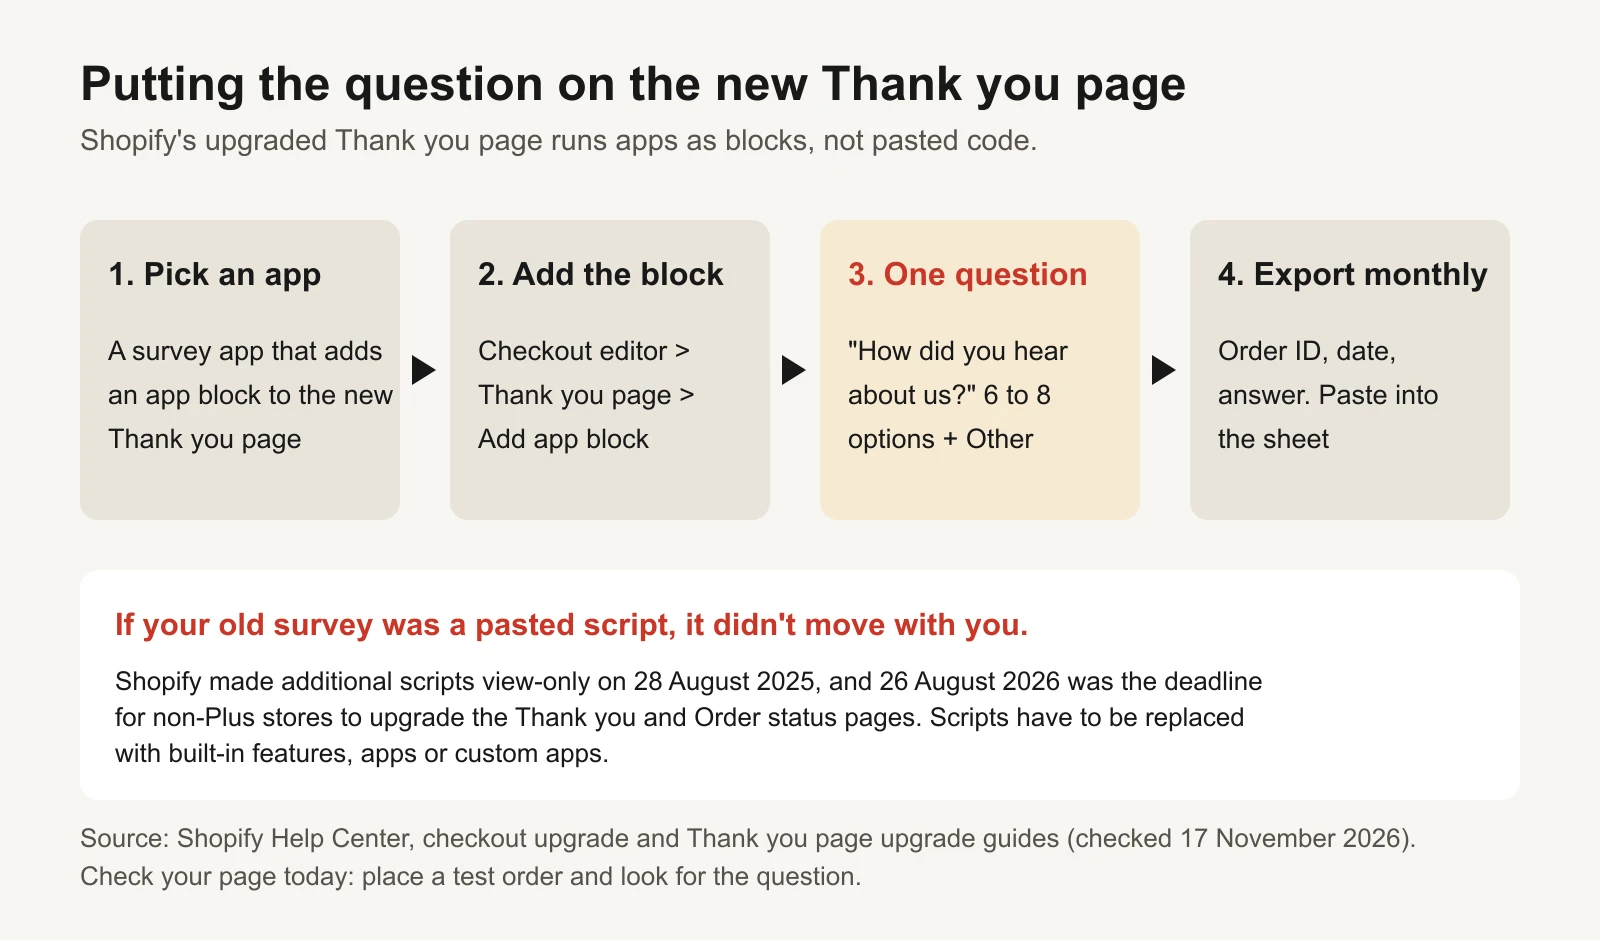
Source: Shopify Help Center. Place a test order after any change.
If your survey was set up a while ago, check it still shows. Shopify has moved the Thank you and Order status pages to a new system where apps add blocks rather than pasted code:
- Since 28 August 2025 the "additional scripts" section in checkout settings is view-only (Shopify: checkout upgrade).
- 26 August 2026 was the deadline for stores on non-Plus plans to upgrade those pages. Scripts on the old pages have to be replaced with built-in features, Shopify App Store apps or custom apps (Shopify: upgrading and replacing your Thank you and Order status pages).
So a survey that was a script pasted into "additional scripts" did not come with you to the new page. The fix is a survey app that supports the new Thank you page as an app block: install it, open the checkout editor, add its block to the Thank you page, and place a test order to see the question under the order confirmation. Most of these apps export order ID, date and answer as a CSV, which is all the sheet needs.
The comparison, step by step
- Export the month's answers (order ID, order date, answer) and paste them into the Answers tab. The Channel column maps each answer to a channel using the Mapping tab; anything it doesn't recognise shows as "Unmapped" in red.
- Type the month's total orders from Shopify on the Settings tab. The sheet works out the response rate.
- On the Compare tab, type each paid channel's reported purchases and spend for exactly the same dates. For Meta, use the attribution setting you normally read and keep it the same every month.
- Read the ratio. Estimated orders = the channel's share of answers × total orders. Said ÷ reported = estimated orders ÷ the platform's own count.
| Said ÷ reported | What the sheet says | What to do |
|---|---|---|
| Under 0.5 | Platform claims far more than buyers remember | Look at view-through and engage-through share; test with a holdout |
| 0.5 to 0.8 | Platform claims more than buyers remember | Normal for Meta with view-through on; watch the trend |
| 0.8 to 1.25 | Roughly in line | Fine |
| Over 1.25 | Buyers credit it more than the platform counts | Common for channels that track poorly; don't cut it on platform numbers alone |
The bands are our rules of thumb. Under 100 answers in a month, the sheet says "Too few answers to read".
Read it per channel, and over time
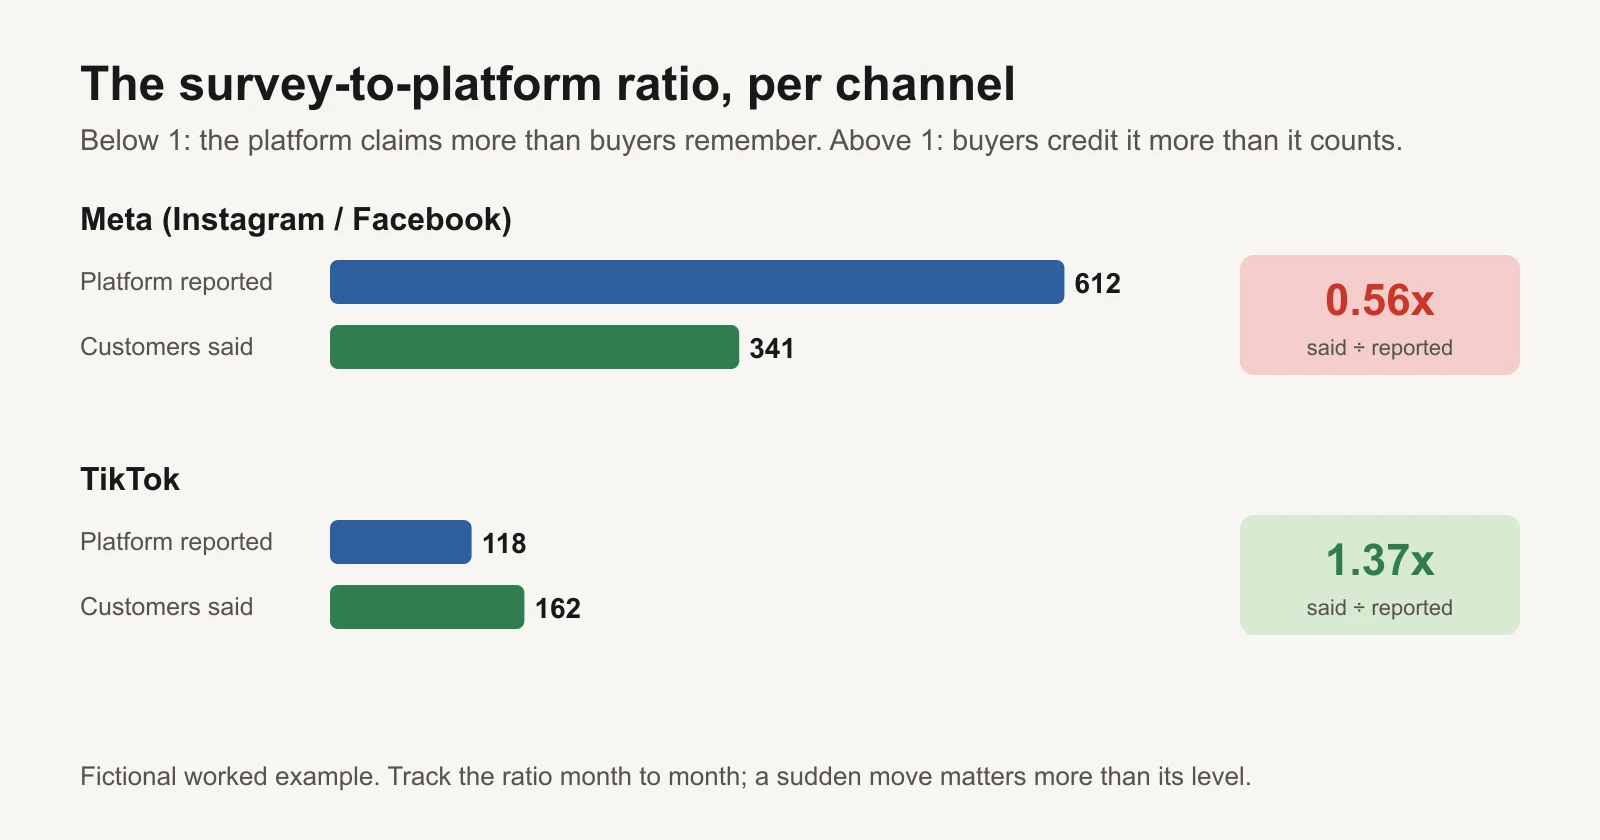
Fictional worked example.
The ratio isn't a correction factor to apply to every report. It's a gauge. In the example, Meta claims more than buyers remember (0.56) while TikTok gets credited more by buyers than its own platform counts (1.37). Judged on platform numbers alone, the store would move money from TikTok to Meta. Judged on the survey alone, the opposite. Both channels deserve a proper test before a big budget move.
What matters most is the trend. The Monthly tab keeps one row per month and highlights any month where the Meta ratio moves by 0.15 or more. A sudden drop usually means something changed: a new attribution setting, more retargeting, a creative mix that leans on view-through, or a broken survey. A steady ratio means you can read Ads Manager with a known discount.
Mistakes that break the survey
- Leading options. "Instagram ad" and "Facebook ad" as two options, but no "friend". Paid channels win by design.
- Asking two things. "How did you hear about us and why did you buy?" Answers stop meaning anything.
- Comparing different dates. Survey answers for October against Meta's last 30 days.
- Changing the attribution setting between months. The ratio moves for no real reason.
- Reading a small month. 60 answers split seven ways is noise.
- Treating the survey as the truth. It measures memory, not cause.
Or let GaaS read it for you
GaaS is an AI agent that creates, launches and optimises Meta ads from three inputs: your website, a spend limit and a one-line goal. It reads platform numbers alongside your store's orders, flags when they drift apart, and asks before anything that changes spend. If you'd rather do it yourself, the sheet does the comparison.
Limits of this kit
- A survey records what buyers remember and choose to say. It doesn't measure cause, and people who don't answer may differ from those who do.
- Platform counts include view-through, engage-through and modelled conversions. A gap between the two is expected, not an error.
- We found no trustworthy benchmark for how many buyers answer a Thank you page survey, so we don't give one. Track your own response rate.
- The ratio bands are our rules of thumb. For budget decisions, run an incrementality test.
- The example store, its orders and answers are fictional.
Sources
- Jon Loomer: Meta ads attribution in 2026 (default: 7-day click, 1-day engage-through, 1-day view; checked 17 November 2026)
- Shopify Help Center: Checkout upgrade (non-Plus deadline 26 August 2026; additional scripts view-only from 28 August 2025)
- Shopify Help Center: Non-Plus: upgrading and replacing your Thank you and Order status pages