
Your Amazon ACoS dropped from 30% to 22%. Congratulations: your ads may have just eaten your organic sales.
ACoS is the number in every Amazon ads report and every agency update, and lower looks better. But it only measures sales your ads got credit for. It can't see the sales you were getting anyway, and it can't tell when ads start taking credit for them. That's what TACoS is for.
This guide explains both numbers in plain words, shows where to find them, walks through a 12-week worked example where ACoS improved while the business got worse, and gives you a free calculator workbook that flags the pattern week by week and product by product. It's written for Amazon sellers who run their own Sponsored ads, with enough detail for whoever manages them.
The workbook has a Weekly tab (ACoS, TACoS, organic sales, profit after ads and a verdict for each week, with two charts), a Products tab for your biggest ASINs, and a Settings tab for your margin. The brand and its numbers in this article are a fictional worked example.
The two numbers
| ACoS | TACoS | |
|---|---|---|
| Formula | Ad spend ÷ ad-attributed sales × 100 | Ad spend ÷ total sales × 100 |
| What it measures | How efficiently your ads win credit for sales | How much of your whole business you pay ads for |
| Where the inputs live | Amazon Ads (campaign manager, Sponsored ads reports) | Ad spend from Amazon Ads; total sales from Seller Central Business Reports |
| Falls when | Ads get more efficient, or ads get credit for sales that would have happened anyway | Total sales grow faster than ad spend |
Amazon Ads defines ACoS as ad spend ÷ ad revenue × 100 (Amazon Ads: ACOS guide). TACoS (total advertising cost of sales) uses the same spend over all your revenue, ad-attributed plus organic (Jungle Scout: Amazon TACoS, Perpetua: TACoS).
Amazon's own ACoS guide doesn't mention TACoS, and sellers usually work it out themselves: ad spend from Amazon Ads, total sales from Seller Central > Reports > Business Reports > Sales and traffic. Some ad tools show it as a column. Check what your own console shows; whichever you use, the inputs must cover the same dates and the same marketplace.
Two more words, defined once:
- Organic sales = total sales − ad-attributed sales. The sales Amazon didn't credit to an ad.
- Margin before ads = what an average sale leaves you after product cost, Amazon's fees and shipping, before ad spend. It is also your break-even ACoS: above it, each ad-attributed sale loses money.
The worked example: 12 weeks of "better" ACoS
A fictional cookware brand ran its Sponsored Products, Sponsored Brands and Sponsored Display campaigns harder over 12 weeks. Each week:
| Week 1 | Week 12 | Change | |
|---|---|---|---|
| Ad spend | $6,000 | $11,000 | +$5,000 (+83%) |
| Ad-attributed sales | $20,000 | $50,000 | +$30,000 (+150%) |
| Organic sales | $55,000 | $27,000 | −$28,000 (−51%) |
| Total sales | $75,000 | $77,000 | +$2,000 (+2.7%) |
| ACoS | 30.0% | 22.0% | down 8 points |
| TACoS | 8.0% | 14.3% | up 6.3 points |
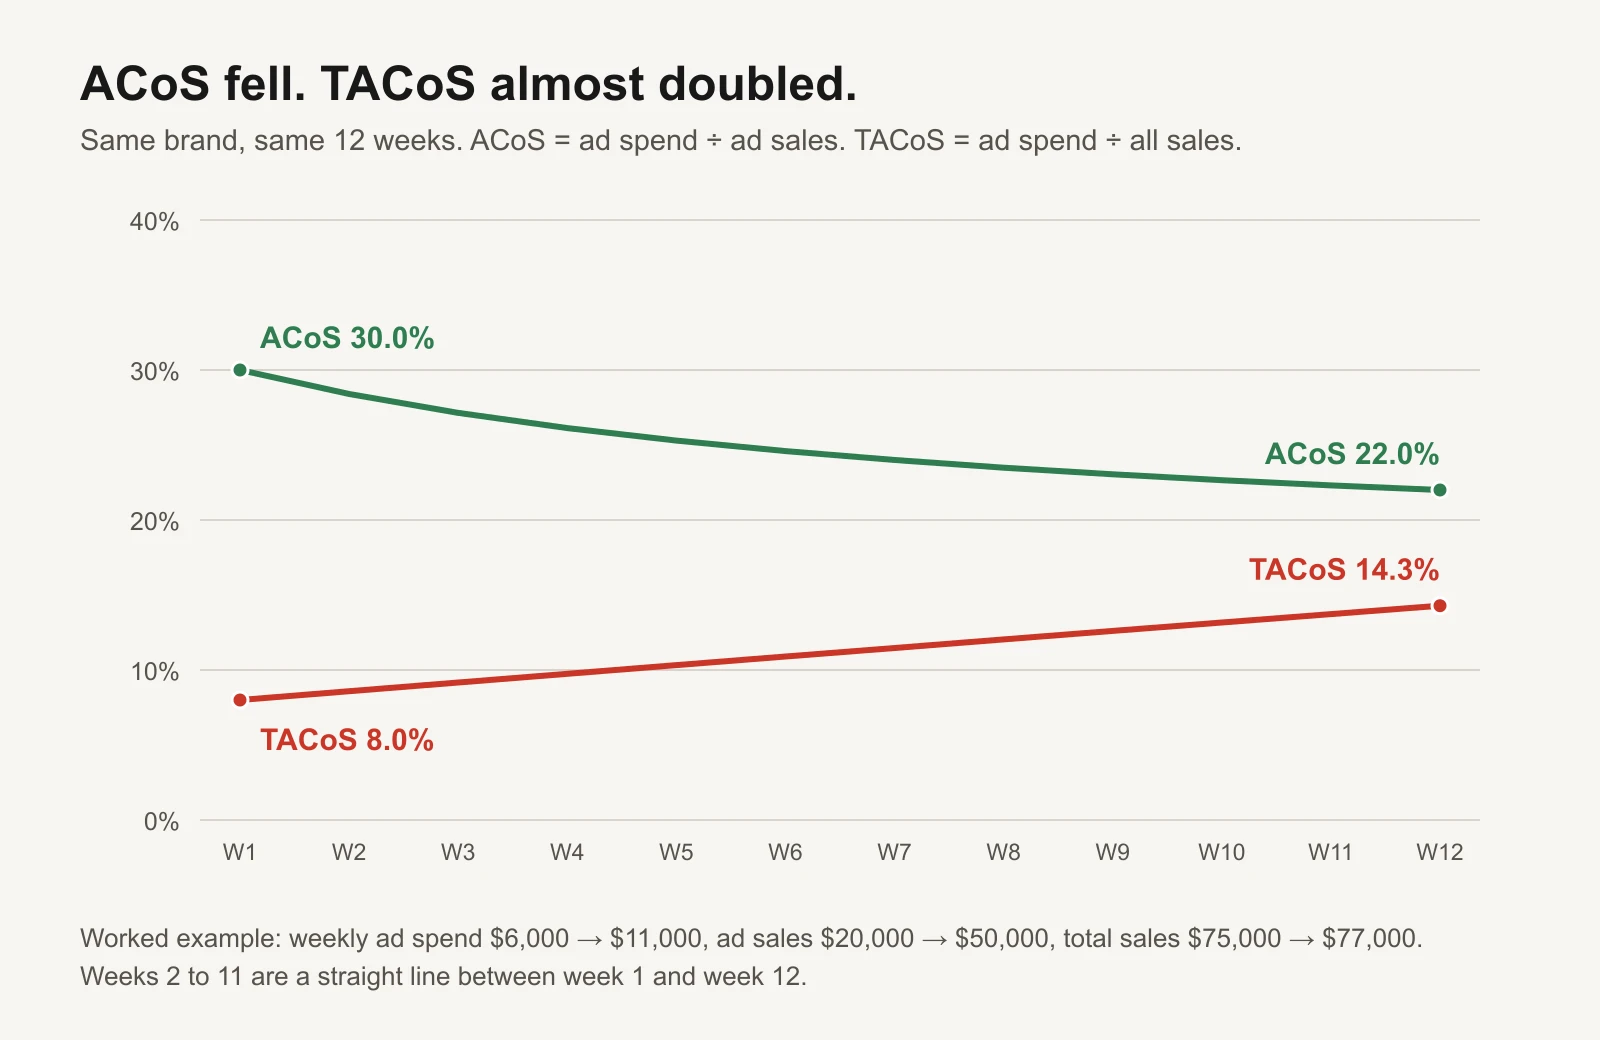
Worked example. Weeks 2 to 11 are a straight line between week 1 and week 12.
Read only the ad report and this is a success story: ad sales up 150%, ACoS down 8 points. Add Business Reports and it isn't. Total sales barely moved.
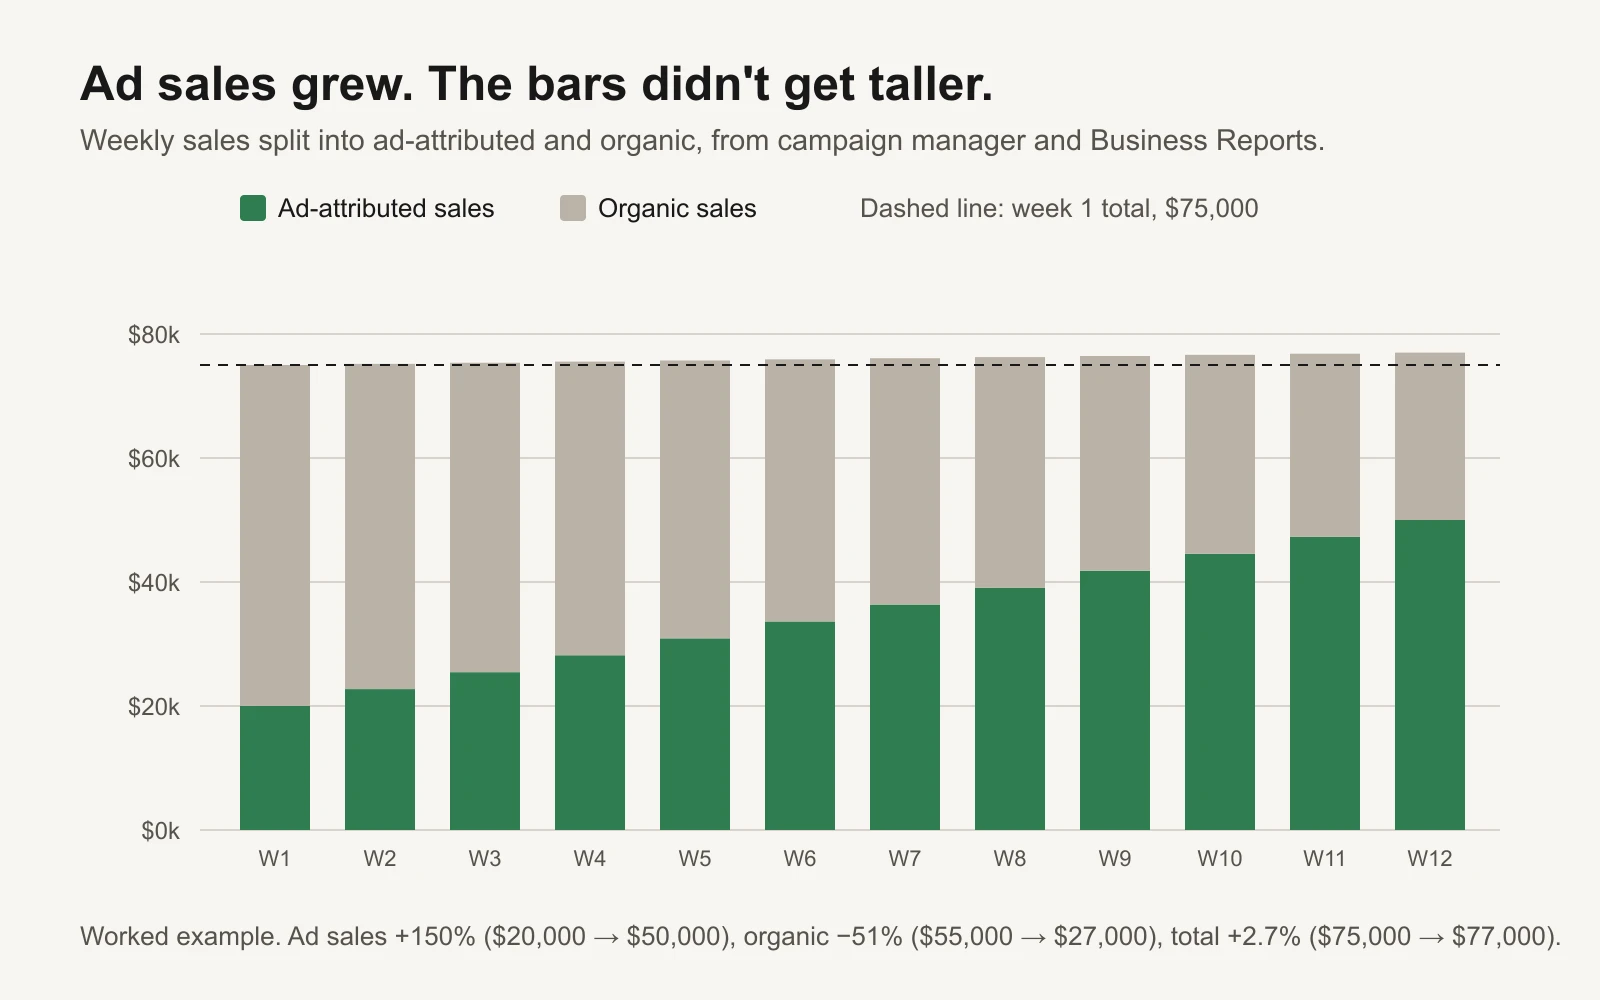
Where the extra ad sales came from
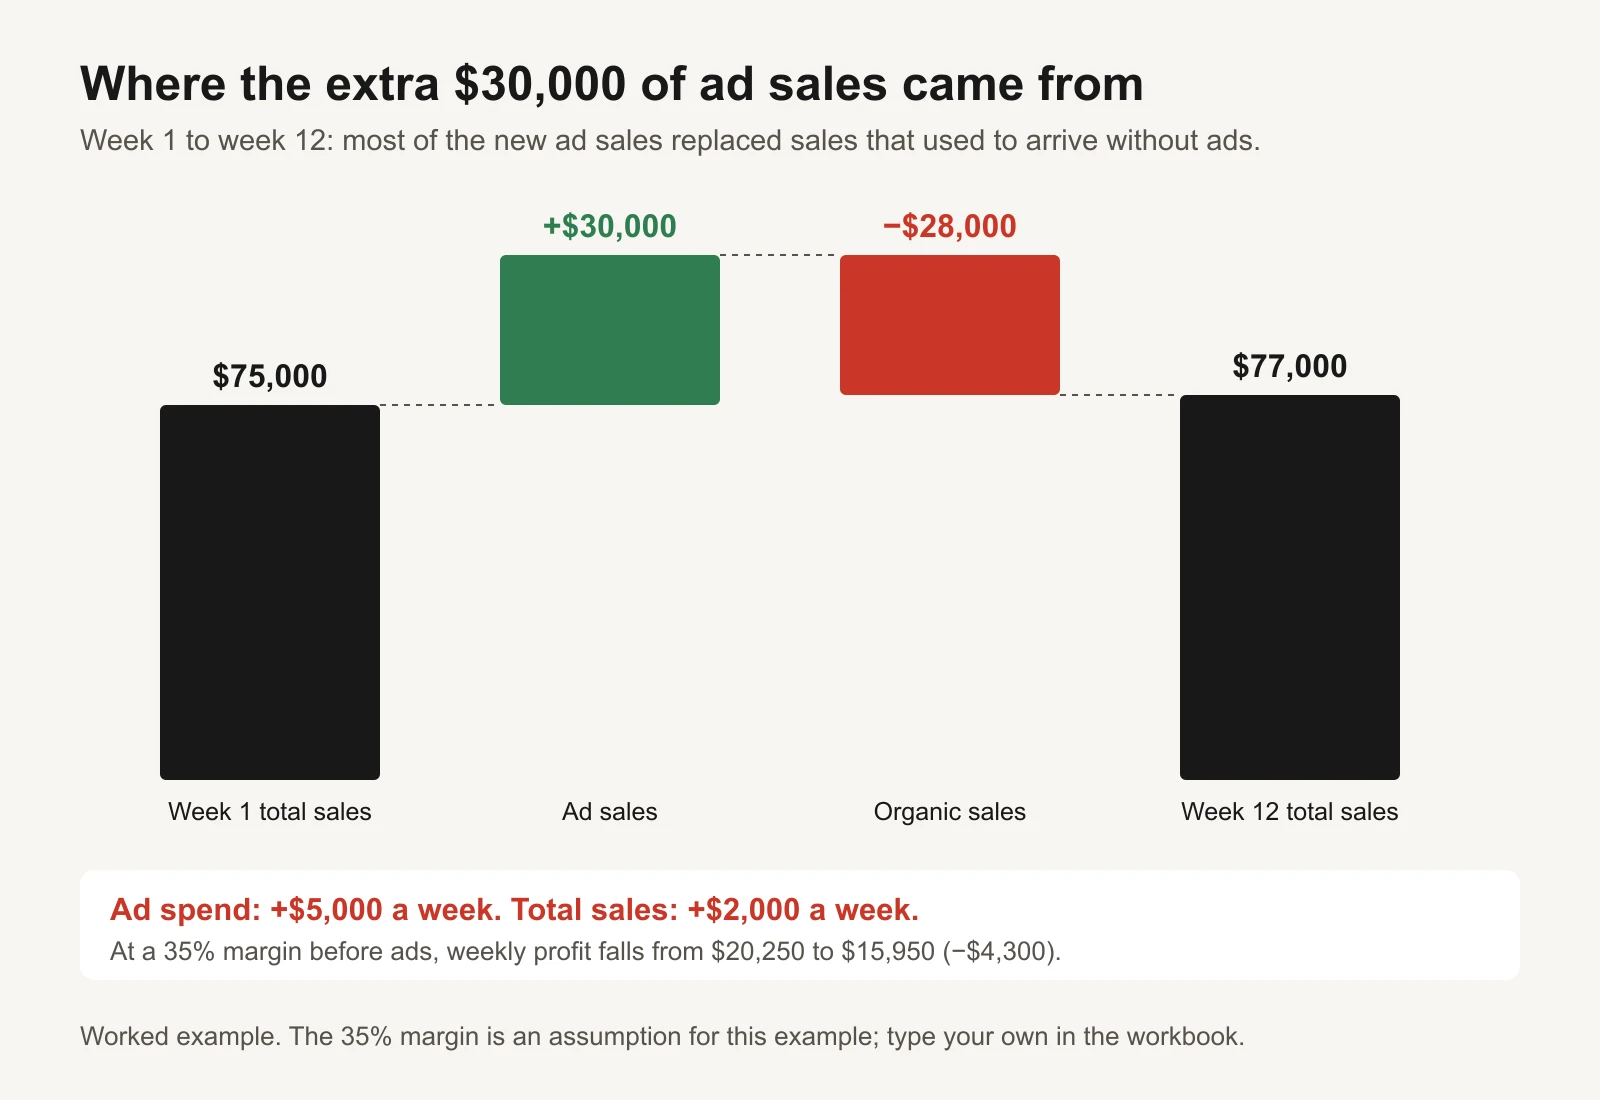
The brand spent $5,000 more a week and got $2,000 more in sales. Each extra $1 of ads bought $0.40 of extra sales. At a 35% margin before ads (our assumption for the example), weekly profit after ads went from $20,250 to $15,950: down $4,300 a week, while every ad report said things were improving.
How does that happen? The usual story is ads bidding on shoppers who were already going to buy: your own brand name, your bestseller's main keyword where you already rank, retargeting people who viewed the product page. Those clicks convert well, which pulls ACoS down, but many of those sales were coming anyway. Amazon credits them to the ad, and the organic line shrinks.
We can't prove from these numbers alone that every lost organic sale was taken by an ad. Rank changes, a competitor, stock-outs or a price change can also move organic sales. That's why the test below compares total sales with spend over several weeks, and why the workbook flags the pattern for a closer look rather than calling it proven.
Read ACoS and TACoS together
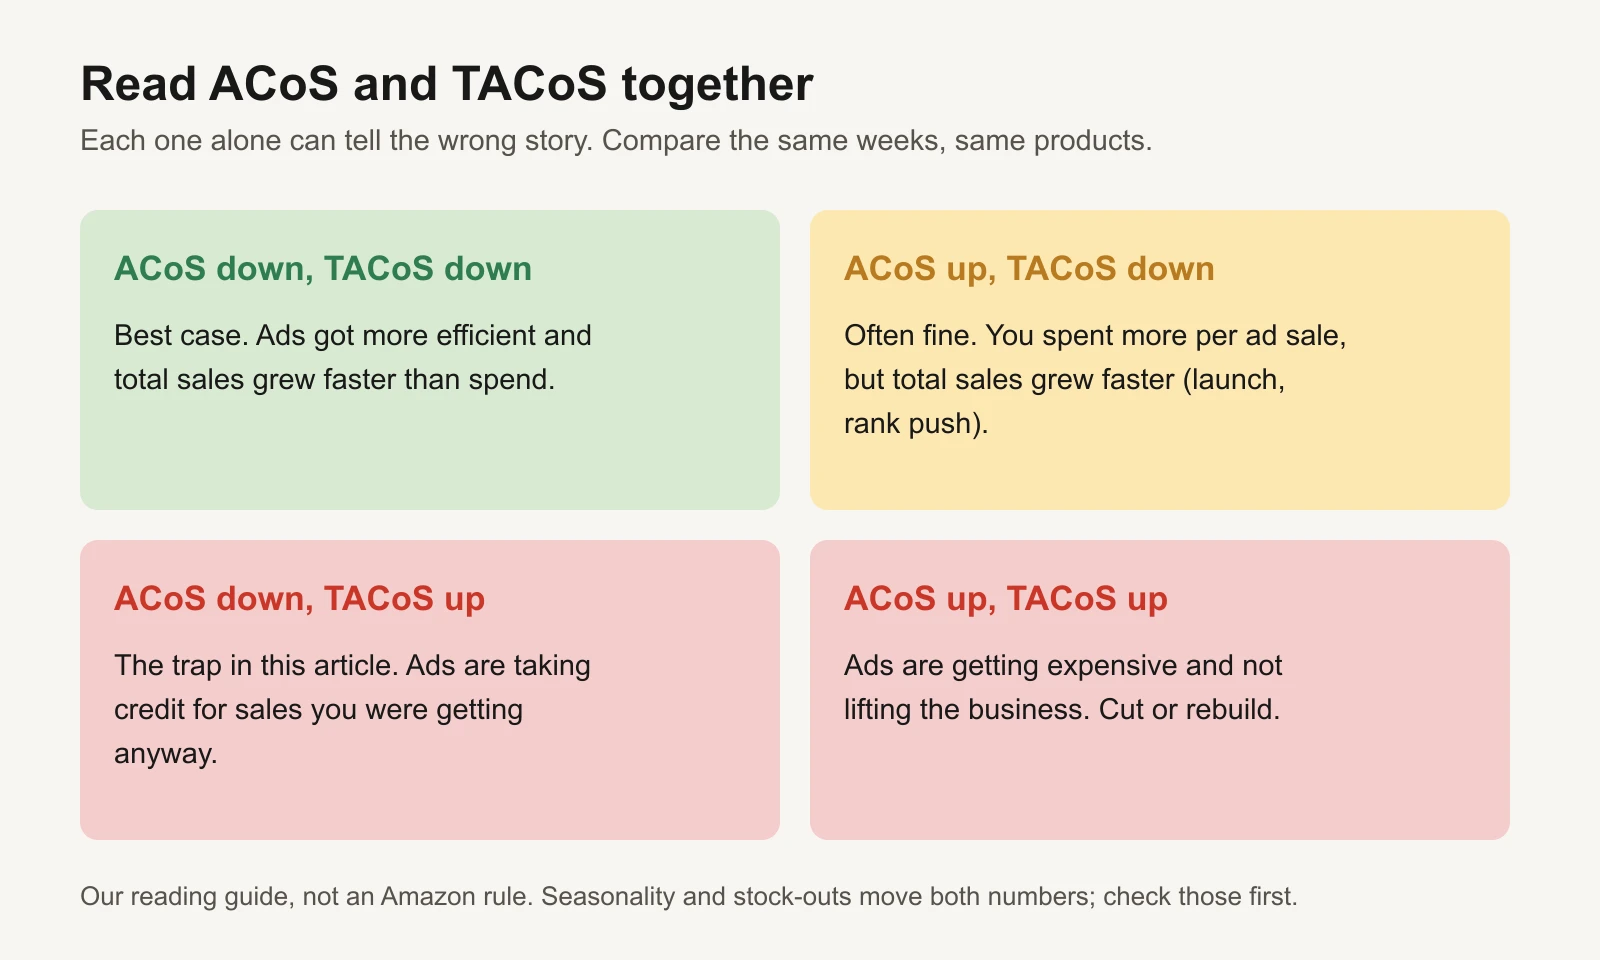
The pattern that matters is ACoS down, TACoS up. It looks like progress in the ad report and costs you money in the bank. The opposite pattern, ACoS up and TACoS down, is often fine: a launch or rank push can cost more per ad sale while total sales grow faster than spend.
The one-line test
Whenever you raise ad spend, ask:
Extra total sales ÷ extra ad spend = how many dollars of sales each extra $1 of ads bought
Compare it with 1 ÷ your margin before ads. At a 35% margin that's about 2.9: each extra $1 of ads needs to bring in about $2.90 of extra total sales just to break even. In the example it brought in $0.40.
The workbook defaults the minimum to 3 and lets you change it. The same idea, for Meta and Google budgets, is in our marginal ROAS guide.
How to use the calculator
- Settings. Type your margin before ads (after product cost, Amazon fees and shipping) and the TACoS ceiling you want to stay under. The example uses 35% and 12%.
- Weekly. For each week, type ad spend and ad-attributed sales from Amazon Ads and total sales from Business Reports. The sheet works out organic sales, ACoS, TACoS, organic share, profit after ads, and extra sales per extra $1 against week 1. Each week gets a verdict, and the summary compares your first and last week.
- Products. Do the same for your biggest ASINs over one date range. Each product gets a verdict: ACoS above its margin (ad sales lose money), over your TACoS ceiling, or fine.
In the example's product tab, the grill pan is fine (ACoS 16.7%, TACoS 6.4%), the Dutch oven is over the ceiling with three quarters of its sales coming through ads, and the skillet set and pizza pan have ACoS above their margin: every ad-attributed sale loses money.
What to do when you see the trap
- Split brand from non-brand. Put your brand-name keywords in their own campaigns so you can see what they cost and how much of their sales were organic before.
- Test pulling back, one thing at a time. Lower bids or pause one campaign that targets shoppers who already know you, for two to four weeks, and watch total sales, not ad sales. If total sales hold, the ads were mostly taking credit.
- Move the budget to new customers. Keywords and products where you don't rank yet, competitor targeting and new-to-brand shoppers are where ads can add sales instead of relabelling them.
- Set a TACoS ceiling from the profit you need after ads, and review it monthly next to ACoS.
Or let GaaS watch the whole picture
GaaS is an AI agent that creates, launches and optimises ads from three inputs: your website, a spend limit and a one-line goal. It judges ads on what they add to the business, not on the platform's own credit, and asks before anything that changes spend. Today it runs Meta and Google ads; for Amazon, the calculator does the same maths by hand.
Limits
- TACoS uses all your sales, so anything that moves organic sales (seasonality, stock-outs, price changes, reviews, rank) moves it too. Rule those out before blaming ads.
- Ad-attributed sales follow Amazon's attribution rules and can include sales of other products from your brand. Compare like with like, week after week.
- The example's 35% margin, 12% TACoS ceiling and 3x minimum are assumptions for illustration. Use your own.
- Week-to-week numbers are noisy. Compare blocks of two to four weeks before acting.
- This is arithmetic on your reports, not a causal test. A clean holdout test (pausing a campaign for a set period) is stronger evidence.
Sources
- Amazon Ads: ACOS (advertising cost of sales) guide
- Jungle Scout: Amazon TACoS
- Perpetua: Amazon TACoS