
Your ad did its job. People stopped scrolling, read it, and clicked. Click-through rate (CTR, the share of people who saw the ad and clicked) looks healthy. And then nothing. Sales don't follow.
When that happens, most people change the ad. Often the ad isn't the problem. The money is leaking somewhere between the click and the payment: a slow page, a headline that doesn't match the ad, a surprise shipping fee, a checkout that wants an account, or tracking that can't see the sale.
This audit walks through 25 checks in the order a visitor meets them. Each one has why it matters, a test you can do in about two minutes, and the fix. You don't need to be a developer for most of them. Where you do, the check tells you exactly what to ask for.
The workbook scores all 25 checks with weights, ranks the fixes by impact against effort, tracks owner and status, includes a funnel calculator to find your biggest leak, and a speed log that colours your Core Web Vitals.
First, find where people drop
Before you fix anything, look at the steps between the click and the sale. Every ad platform and analytics tool counts them a little differently, but the shape is the same.
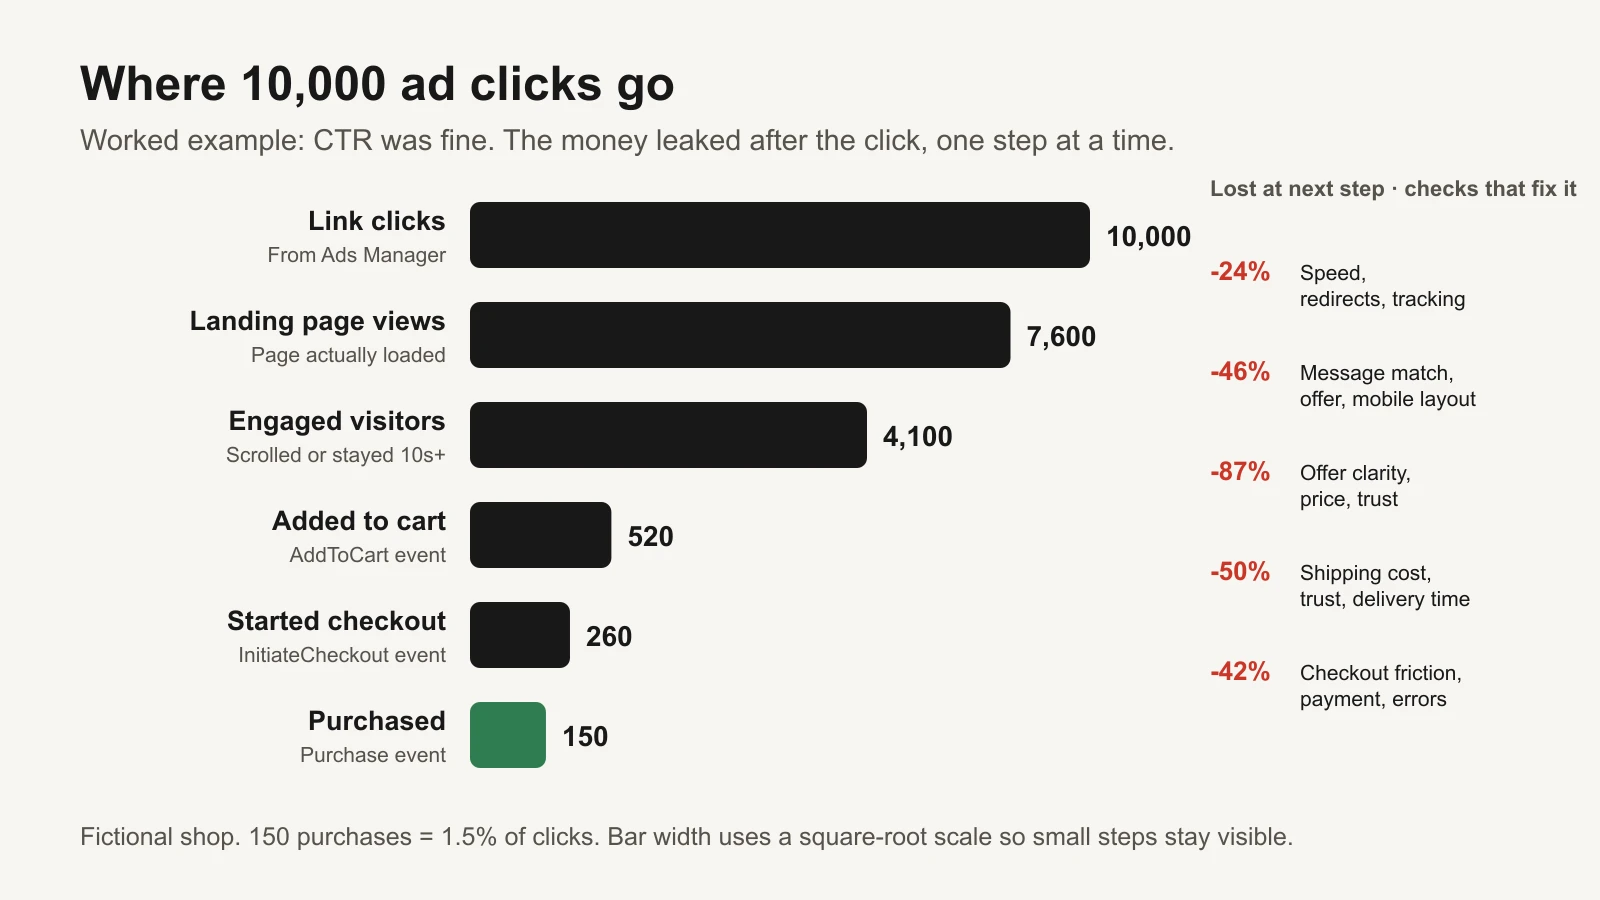
Worked example (fictional): every step leaks. Each group of checks below targets one of these leaks.
How to get your own numbers:
- Link clicks and landing page views are both columns in Meta Ads Manager. A landing page view counts when the page actually loads after the click. A big gap between the two usually means a slow page, a redirect, or tracking that loads late. Our guide to the clicks vs landing page views gap goes deeper.
- Add to cart, checkout started and purchases come from your Meta events (AddToCart, InitiateCheckout, Purchase) or from Google Analytics 4 (GA4). GA4's funnel exploration shows how many users complete or drop off at each step.
- Engaged visitors can be GA4 engaged sessions or a scroll-depth event. It is optional, but it separates "left instantly" from "looked and left".
Put the counts into the workbook's Funnel tab. It shows which step loses the largest share, and how many extra purchases you'd get if that one step improved to a target you choose. In the example, the add-to-cart step keeps only 12.7% of engaged visitors. That's where to look first.
The 25 checks
1. Message match (checks 1–4)
The click is a promise. The first screen of the page should keep it. If someone taps an ad about "the serum that fixed my dry skin in a week" and lands on a homepage carousel about a summer sale, they assume they're in the wrong place.
| # | Check | Why it matters | 2-minute test | Fix |
|---|---|---|---|---|
| 1 | The headline repeats the ad's main promise | People click because of one promise. If the page talks about something else, they assume they are in the wrong place and leave. | Open your top ad and its landing page side by side. Read the ad's first line, then the page's headline. Same idea in the first second? | Rewrite the headline (or make a page variant) that uses the ad's own words. |
| 2 | The offer, price and code from the ad are visible without scrolling | If the ad says 20% off and the page doesn't, visitors hunt for it or stop trusting it. | On a phone, open the page from the ad. Can you see the offer without scrolling? | Add the offer line or a banner at the top of the page; make sure codes apply automatically if you can. |
| 3 | The product or person in the ad also appears on the page | Seeing the same product, colour or face tells people they are in the right place. | Compare the ad's main image with the first screen of the page | Use the ad's hero image, or a close match, near the top of the page. |
| 4 | Each ad sends people to the most specific page | A homepage makes people search for the product they just saw. Every extra step loses some of them. | List your active ads and their final URLs. How many point to the homepage? | Point each ad at the matching product or collection page; build one landing page per main offer if needed. |
2. Speed (checks 5–8)
Speed is measured by three Core Web Vitals, Google's metrics for loading, responsiveness and visual stability. web.dev defines "good" as LCP of 2.5 seconds or less, INP of 200 milliseconds or less, and CLS of 0.1 or less, measured at the 75th percentile of real page loads, separately for mobile and desktop (web.dev: Web Vitals, Defining the thresholds).
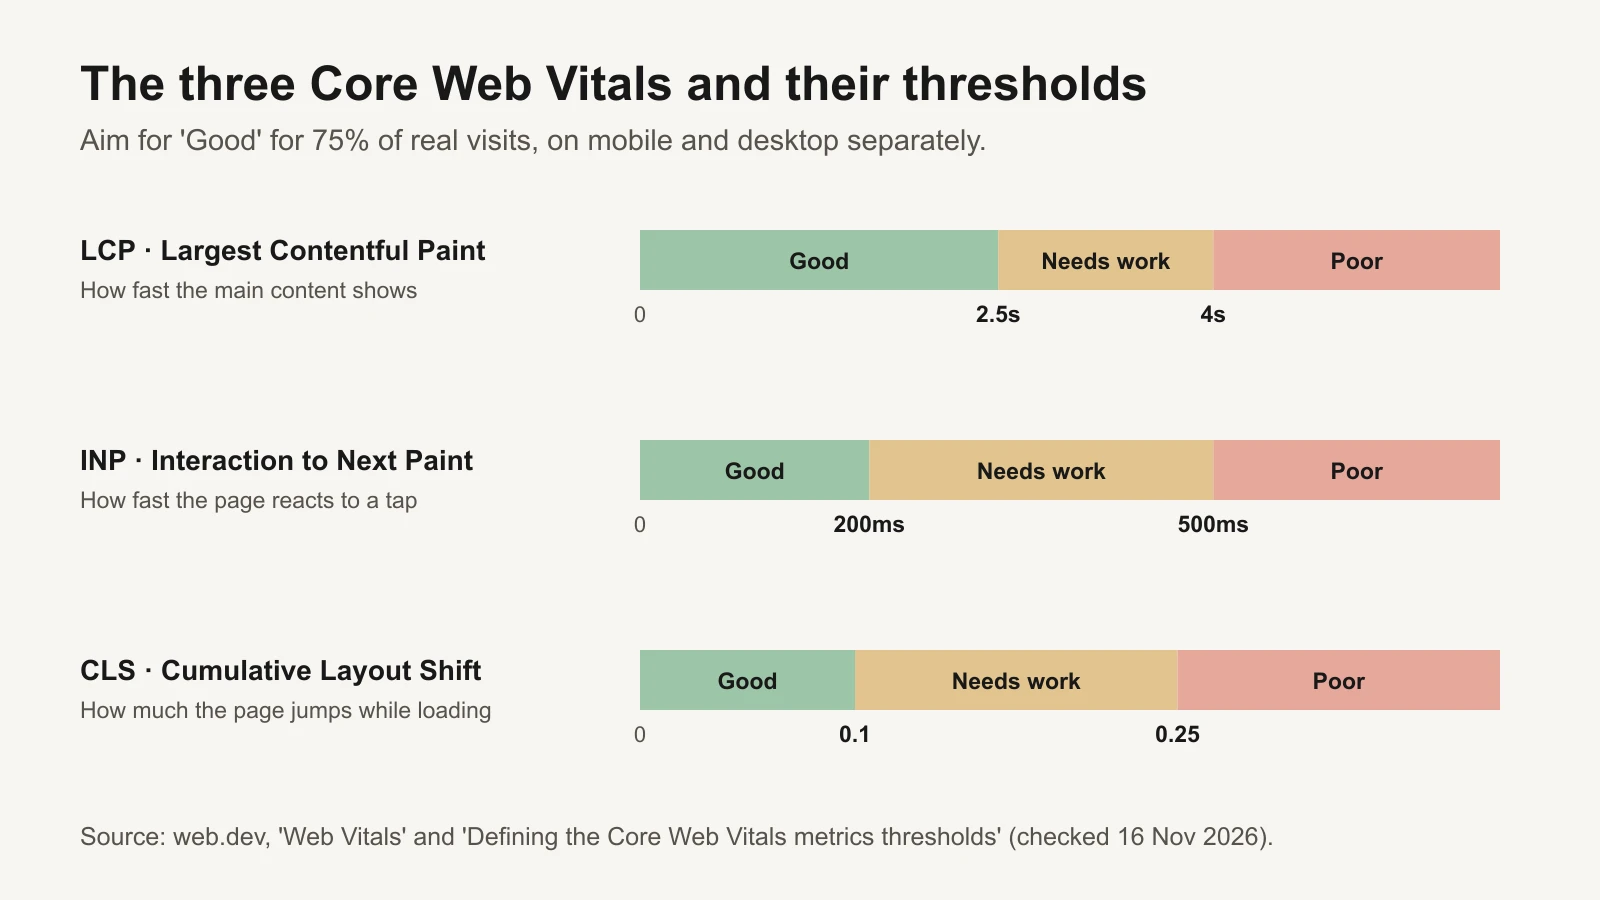
Thresholds from web.dev. Aim for "Good" on at least 75% of real visits.
| # | Check | Why it matters | 2-minute test | Fix |
|---|---|---|---|---|
| 5 | LCP (main content shown) is 2.5 seconds or less on mobile | Largest Contentful Paint is when the main image or text appears. Slow pages lose people before they see anything. | Run the page in PageSpeed Insights. Read the mobile field data (real users) first, lab data second | Compress and resize the hero image, serve it early, cut render-blocking scripts; ask your platform or developer for the specific items PageSpeed lists. |
| 6 | INP (response to taps) is 200 milliseconds or less | Interaction to Next Paint measures how fast the page reacts when someone taps. Laggy buttons feel broken. | PageSpeed Insights field data shows INP when enough real users visited. In the lab, tap 'Add to cart' on a phone and feel for lag | Remove or delay heavy third-party scripts (chat, pop-ups, trackers you don't use); have a developer split long JavaScript tasks. |
| 7 | CLS (layout jumping) is 0.1 or less | Cumulative Layout Shift measures how much the page jumps while loading. Jumps cause mis-taps and distrust. | Load the page on a phone and watch: does the button move as images, banners or reviews load? | Give images and embeds fixed sizes; reserve space for banners and review widgets. |
| 8 | The ad link loads the page directly, with no redirect chain | Each redirect adds waiting time and can drop tracking parameters. | Paste the ad's final URL into a browser with developer tools open (Network tab). Count the redirects before the page loads | Use the final page address in the ad, not a short link or an old URL that redirects. |
Field data vs lab data. PageSpeed Insights shows two kinds of results. Field data comes from real Chrome users over the previous 28 days (the Chrome UX Report). Lab data is a single simulated test run by Lighthouse, useful for finding causes (PageSpeed Insights: About). Judge the page on field data when it exists; use lab data to find what to fix. New or low-traffic pages may have no field data; then lab data is all you have.
Does speed really change sales?
We only cite studies we could read and check. Two are worth knowing, and they are different kinds of evidence:
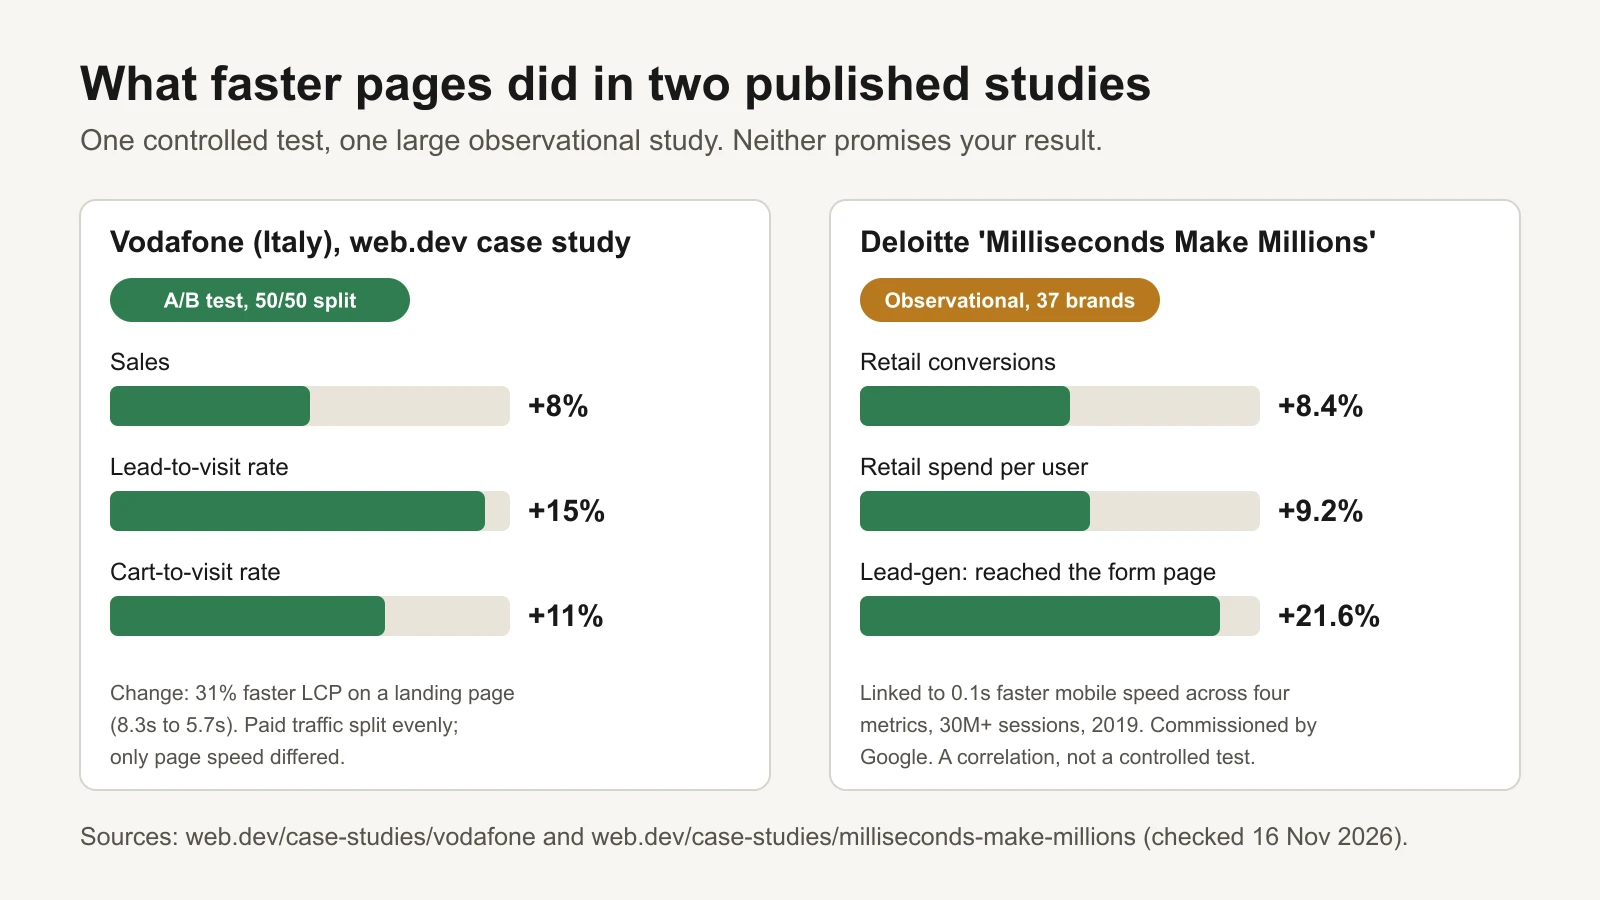
One controlled test and one large correlation study. Neither predicts your exact result.
- Vodafone (Italy) ran an A/B test on a landing page that received paid traffic (display, search and social), split 50/50. The faster version improved LCP by 31% and produced 8% more sales, a 15% better lead-to-visit rate and an 11% better cart-to-visit rate. Only the speed work differed between the versions (web.dev case study). This is the stronger evidence: speed was the only change.
- Deloitte's "Milliseconds Make Millions" (commissioned by Google) looked at 37 European and US brand sites and over 30 million sessions in 2019. When mobile pages got 0.1 seconds faster across four speed metrics, retail conversions were 8.4% higher and retail shoppers spent 9.2% more (web.dev summary, Deloitte report). This is an association across many sites, not a controlled test, and some of the metrics it used have since been replaced.
The honest reading: speed is one of the few landing page changes with controlled evidence behind it, but the size of the effect depends on how slow you start and who your buyers are.
3. Offer clarity (checks 9–12)
Once the page loads, visitors decide fast whether to read on. They need three answers: what is it, is it for me, and what will it cost me in total?
| # | Check | Why it matters | 2-minute test | Fix |
|---|---|---|---|---|
| 9 | In 5 seconds a stranger can say what it is, who it's for and why now | If people can't tell what you sell and why it's for them, they don't scroll to find out. | Show the first screen to someone who doesn't know the business for 5 seconds, then ask them those three questions | Make the headline say what it is and who it's for; add one line on the main benefit and one reason to act now. |
| 10 | The total price, including shipping, is clear before checkout | In Baymard's survey, extra costs were the most common reason shoppers gave for abandoning checkout. | Add the product to the cart as a new visitor. When do you first see shipping and the final total? | Show shipping cost or a free-shipping threshold on the product page; add a shipping estimator to the cart. |
| 11 | There is one clear main action, and its button says what happens | Several competing buttons split attention. Vague labels like 'Submit' make people hesitate. | Count the buttons in the first screen. Is one clearly the main one? Does its text describe the action? | Pick one main action per page; label it with the action ('Add to cart', 'Book a call'); repeat it lower down. |
| 12 | Delivery time and returns are stated near the buy button | Slow delivery and weak returns policies are both common reasons for abandoning checkout in Baymard's survey. | Look within one scroll of the buy button. Can you see when it arrives and how returns work? | Add a short line under the button: delivery estimate and returns window, linking to the full policy. |
4. Trust and proof (checks 13–16)
People who arrive from an ad often don't know your brand. They need proof that others bought and were happy, and reassurance that they can get help or a refund.
| # | Check | Why it matters | 2-minute test | Fix |
|---|---|---|---|---|
| 13 | Reviews show a star rating and a count, near the buy button | Shoppers look for proof from other buyers before paying, especially for a brand they found in an ad. | Is there a rating with a number of reviews within one scroll of the buy button? Are there recent reviews? | Install or move a review widget next to the price; ask recent buyers for reviews with a follow-up email. |
| 14 | Real photos or videos show the product in use | Studio shots alone can look like a dropshipping store. Real use shows size, texture and results. | Scroll the page. Is there at least one photo or video of a real customer or of the product being used? | Add customer photos or short clips (with permission); reuse your best UGC ads on the page. |
| 15 | Guarantee, returns policy and contact details are easy to find | People want to know they can get help or their money back before they risk an order. | From the landing page, how many taps to find a returns policy, an email or phone number, and a business address? | Link returns, contact and about pages in the footer and near the price; show a real way to reach you. |
| 16 | Checkout looks secure and familiar | In Baymard's survey, almost one in five shoppers who abandoned said they didn't trust the site with card details. | Check for HTTPS, recognised payment logos and the same branding all the way through checkout | Use your platform's standard checkout, show accepted payment logos, keep branding consistent, fix any browser security warning. |
5. Mobile layout (checks 17–19)
Check everything on a real phone, not just a narrow desktop window. Small screens hide problems that a laptop never shows.
| # | Check | Why it matters | 2-minute test | Fix |
|---|---|---|---|---|
| 17 | The buy button is easy to reach on a phone | Feed ads are often tapped on a phone, where a button below a long scroll is easy to miss. | Open the page on a phone. Is the main button visible in the first screen, or does a sticky button follow you? | Move the main button higher, or add a sticky add-to-cart bar on mobile. |
| 18 | Text is readable and buttons are easy to tap, with no sideways scroll | Tiny text and cramped links cause mis-taps and zooming. Sideways scrolling signals a broken page. | On a phone, read a paragraph without zooming and tap every button in the first two screens | Increase base font size and spacing between links; fix elements wider than the screen. |
| 19 | No pop-up covers the page in the first seconds | Google describes interstitials that block the content as frustrating for users. An instant pop-up hides the promise people clicked for. | Open the page in a private window on a phone. Does anything cover it before you can read the headline? | Delay email pop-ups (for example until scroll or exit), make them small, or turn them off for ad traffic. |
Google's Search guidance describes pop-ups and interstitials that block the content as a poor experience that frustrates users (Google Search Central: Avoid intrusive interstitials and dialogs). Ad visitors, who clicked for one specific promise, are even less patient.
6. Checkout friction (checks 20–22)
The checkout is where intent turns into money, and where small annoyances cost the most. Baymard Institute's research gives a useful picture of why shoppers abandon. Its average documented cart abandonment rate is 70.22%, across 50 studies (Baymard: Cart abandonment rate). The reasons US shoppers gave for abandoning during checkout:
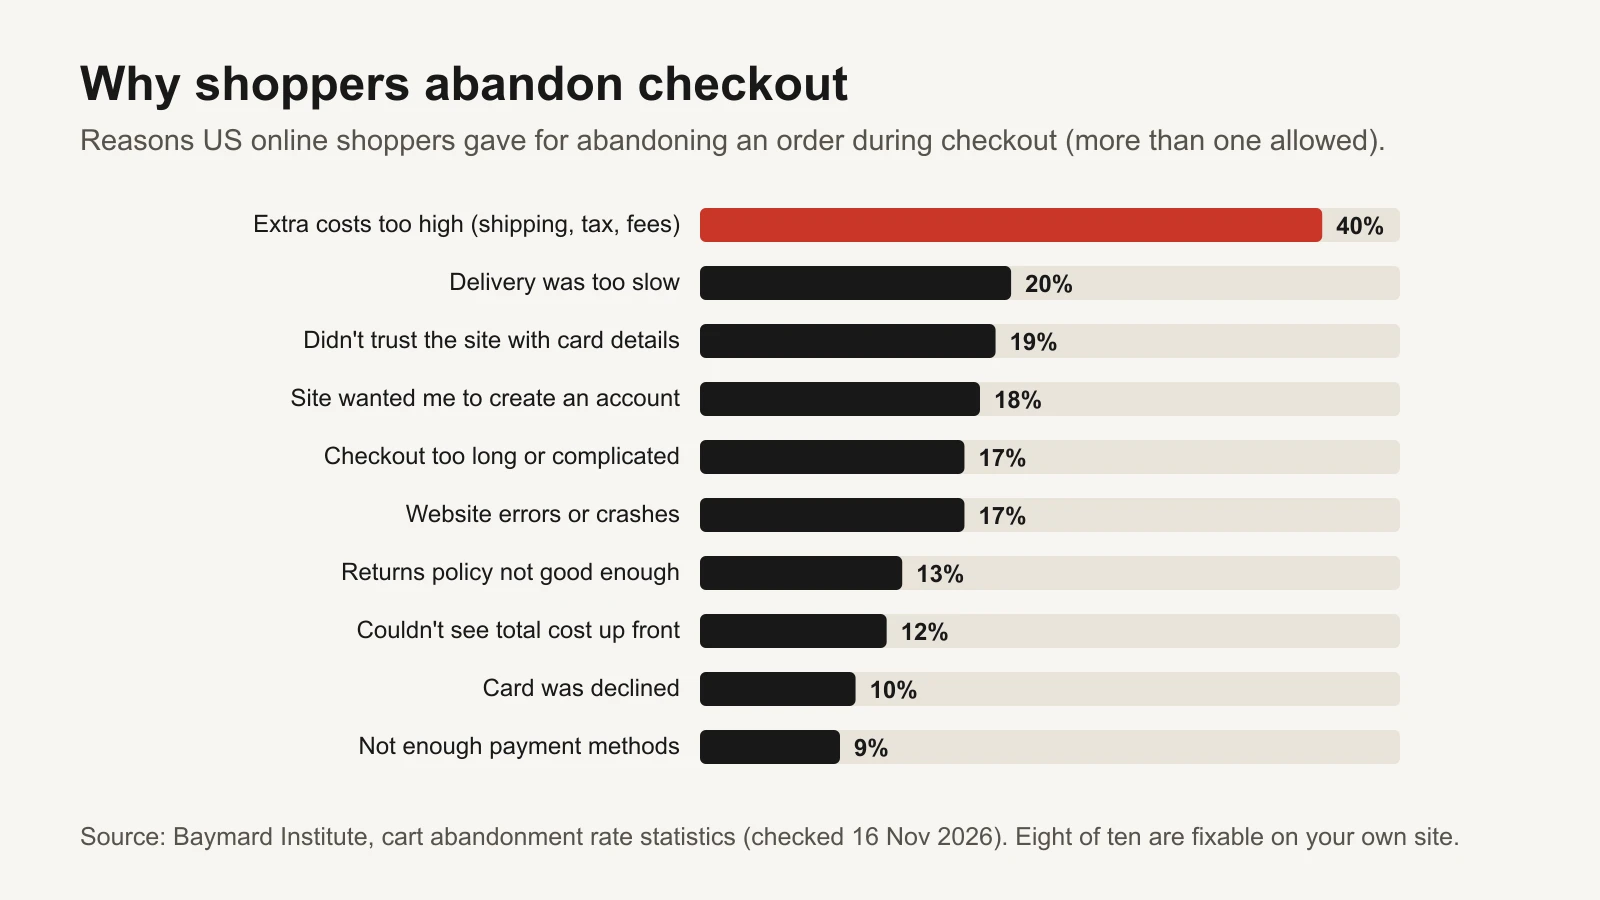
Source: Baymard Institute. Most of these reasons are things you control on your own site.
| # | Check | Why it matters | 2-minute test | Fix |
|---|---|---|---|---|
| 20 | Guest checkout is available | Being forced to create an account was a common reason for abandoning checkout in Baymard's survey. | Go to checkout as a new visitor. Can you pay without creating an account? | Turn on guest checkout; offer account creation after the order is placed. |
| 21 | Express wallets and the payment methods your buyers expect are offered | Typing card details on a phone is slow. Missing payment methods was another reason in Baymard's survey. | On a phone, check for wallets such as Apple Pay, Google Pay, Shop Pay or PayPal at cart and checkout | Enable the wallets your payment provider supports; show them at the cart, not only at the last step. |
| 22 | Forms are short, use autofill and show clear errors | Long or confusing checkouts and site errors are both common abandonment reasons. | Complete a test checkout on a phone up to the payment step. Count fields; enter a wrong postcode on purpose and read the error | Remove fields you don't need, turn on address autocomplete, show errors next to the field in plain words. |
7. Tracking (checks 23–25)
Tracking isn't what visitors see, but it decides what your ads learn. If Meta can't see purchases, or sees each one twice, it optimises for the wrong people and your reports lie to you. That makes every other fix harder to judge.
| # | Check | Why it matters | 2-minute test | Fix |
|---|---|---|---|---|
| 23 | The purchase event fires once per order, with the right value and currency | If Meta can't see sales correctly, it optimises for the wrong people, and your ROAS reads wrong. | Use Meta Ads Data Advisor (formerly Pixel Helper) and the Test events tab in Events Manager during a test order. Count the Purchase events and check the value | Fix duplicate tags; if you send events from both browser and server (Conversions API), use matching event names and event IDs so Meta can deduplicate. |
| 24 | Click IDs and UTM parameters survive redirects and checkout | Lost parameters break attribution, so you can't tell which ads sold. | Click your own ad (or paste the URL with parameters), go through to checkout, and check the parameters are still in the address bar or recorded in analytics | Remove redirects that strip query strings; check your checkout domain is set up for cross-domain tracking. |
| 25 | Every funnel step is tracked: view, add to cart, checkout, purchase | Without each step you can't see where people drop, so you fix the wrong thing. | In Events Manager or GA4, check ViewContent (view_item), AddToCart, InitiateCheckout (begin_checkout) and Purchase all have counts for last week | Add the missing events through your platform's Meta and Google integrations; then build a GA4 funnel exploration. |
If you send purchases from both the browser (Meta Pixel) and your server (Conversions API), Meta removes duplicates only when the event name matches and the pixel's event ID matches the server's event ID (Meta: Deduplicate Pixel and server events). Our deduplication audit walks through it. Meta's browser extension for checking this is now called Meta Ads Data Advisor (formerly Meta Pixel Helper) and works in Chrome and Edge (Meta for Developers).
Fix in the right order
25 checks can feel like a lot. You don't fix them all at once. Score each failed check for impact (how much it could change sales, 1 to 5) and effort (1 = minutes, 5 = a project). The workbook ranks them by impact × (6 − effort), so big, easy fixes rise to the top. Partial passes count at half.
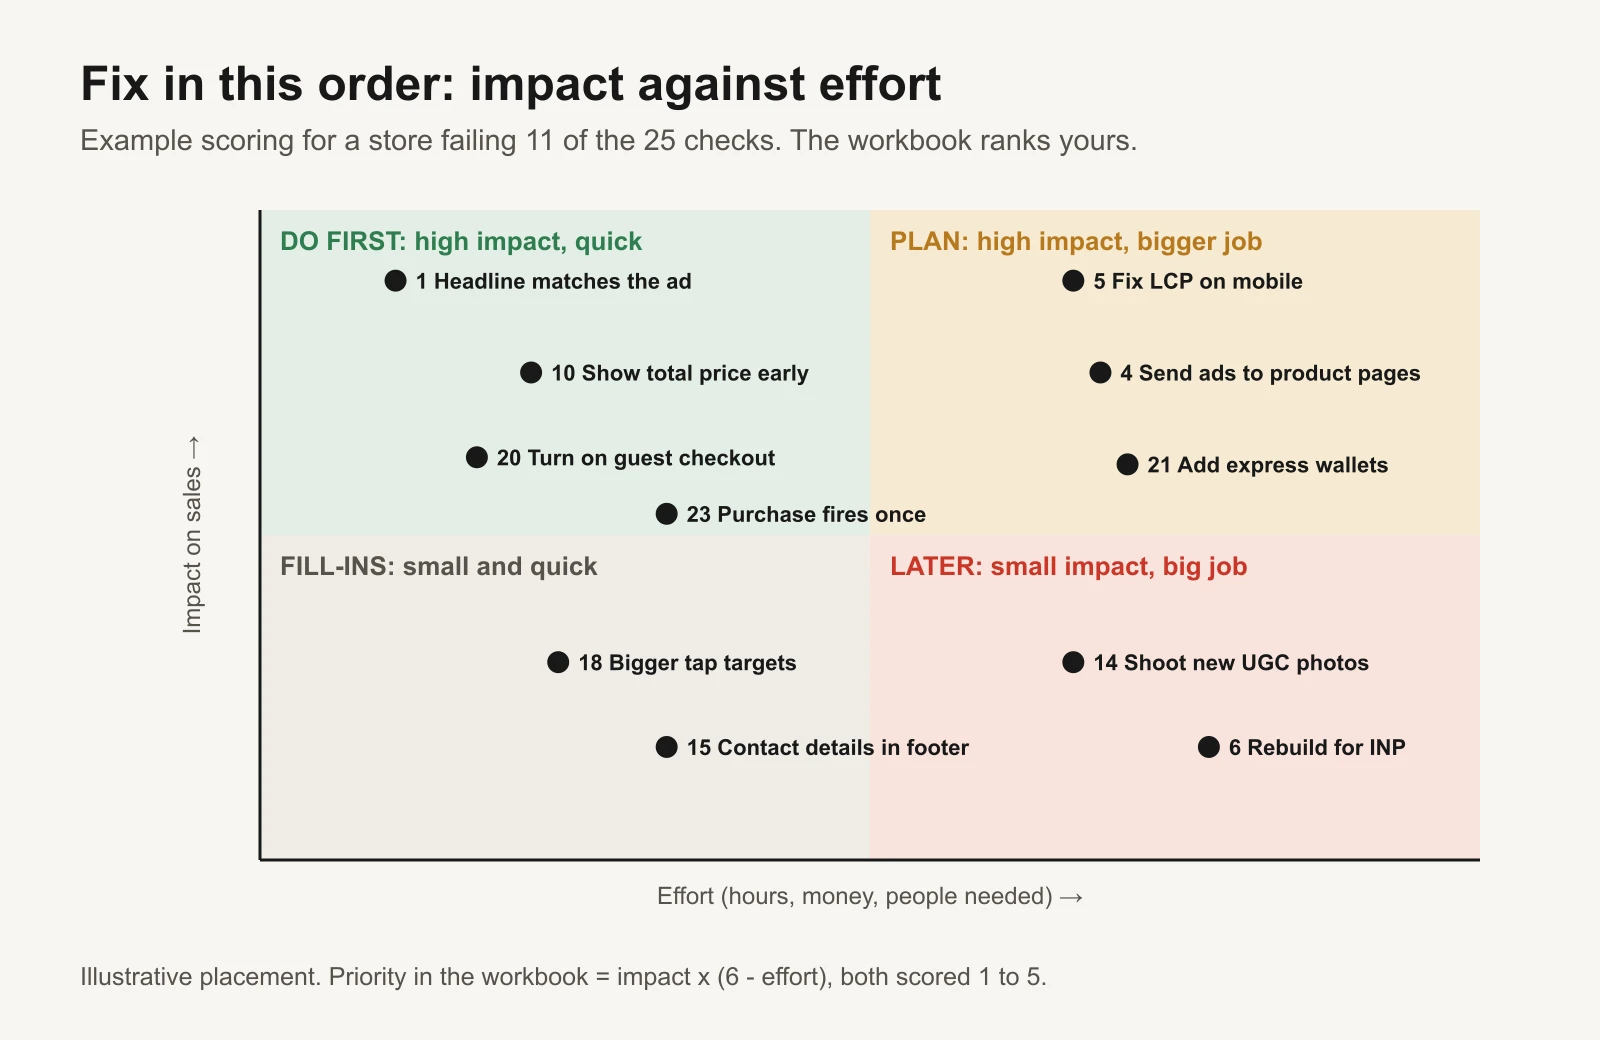
Illustrative scoring. Your own impact and effort scores decide your order.
A good first week usually looks like this:
- Fix anything that breaks tracking (check 23). Otherwise you can't measure the rest.
- Make the headline and first screen match your top ads (checks 1 and 2).
- Show the total price, delivery time and returns near the buy button (checks 10 and 12).
- Turn on guest checkout and express wallets if your platform supports them (checks 20 and 21).
- Run PageSpeed Insights and send the top three speed items to whoever runs your site (check 5).
- Re-run the audit, save the dated workbook, and compare the funnel a week later.
When you compare before and after, keep the ads the same so you are measuring the page, not a new campaign. For a sharper answer, split traffic between the old and new page with your platform's A/B testing tool. Then use the Kill / Hold / Scale rulebook to judge the ads again on the improved page; an ad that was a HOLD may move into the scale band.
Free tools and repos
Every tool here is free, and every repository was checked on 16 November 2026.
| Tool or repo | What it does | Who should use it |
|---|---|---|
| PageSpeed Insights | Field data (real Chrome users, last 28 days) plus a Lighthouse lab test, for mobile and desktop | Everyone. Start here for checks 5–7 |
| GoogleChrome/lighthouse | Google's open-source auditing tool for performance, accessibility and best practices. Also built into Chrome DevTools | Anyone who wants lab tests on demand |
| GoogleChrome/web-vitals | A small JavaScript library that measures LCP, INP and CLS for your real visitors and sends them to your analytics | Developers who want field data for pages without enough Chrome UX Report traffic |
| GoogleChrome/lighthouse-ci | Runs Lighthouse on every code change and blocks changes that make the page slower | Teams with a developer and a code repository for their site |
| Chrome UX Report (CrUX) | Google's public dataset of real-user Core Web Vitals, which powers PageSpeed field data | Comparing your origin over time |
| ChromeDevTools/chrome-devtools-mcp | An MCP server that lets AI coding assistants control Chrome, record performance traces and read console errors | Developers who want an AI assistant to find why a page is slow |
| microsoft/playwright-mcp | An MCP server for browser automation with Playwright; its companion microsoft/playwright-cli offers the same with agent skills | Letting an assistant click through your checkout on a phone-sized screen and report broken steps |
| microsoft/clarity | The open-source library behind Microsoft Clarity, a free heatmap and session-recording tool | Owners who want to watch where real visitors scroll, tap and give up |
| Meta Ads Data Advisor | Meta's browser extension (formerly Pixel Helper) that checks your Meta Pixel setup | Checks 23–25 |
| GA4 funnel exploration | Shows completion and drop-off at each step you define | Building the funnel at the top of this article |
A practical use of the AI tools: ask an assistant with the Chrome DevTools MCP connected to "load my product page on a mobile-sized screen, record a performance trace, and list the three biggest causes of slow LCP in plain words". You get the developer brief for check 5 in minutes. As always, check its claims before you act on them.
Or let GaaS keep an eye on it
GaaS is an AI agent that creates, launches and optimises Meta and Google ads from your website URL, a spend limit and a one-line goal. It writes ads from what your website actually says, which keeps the ad and the page telling the same story, and it judges ads on purchases rather than clicks. Nothing that changes spend happens without your approval. The audit below works the same with or without it.
Limits
- The audit is a structured review, not a prediction. A higher score doesn't guarantee more sales.
- Weights, impact and effort scores in the workbook are starting points. Change them to fit your business.
- The studies cited describe other businesses. Vodafone's result comes from a controlled test; Deloitte's is a correlation across many sites.
- Baymard's percentages come from its survey of US online shoppers and may differ in other markets.
- Funnel numbers in this article and the workbook are fictional examples.
Sources
- web.dev: Web Vitals, Defining the Core Web Vitals metrics thresholds, LCP, INP, CLS
- web.dev case studies: Vodafone: a 31% improvement in LCP increased sales by 8%, Milliseconds make millions
- Deloitte: Milliseconds Make Millions
- Google for Developers: About PageSpeed Insights
- Google Search Central: Avoid intrusive interstitials and dialogs
- Baymard Institute: Cart abandonment rate statistics
- Meta for Developers: Deduplicate Pixel and server events, Meta Ads Data Advisor
- Google Analytics Help: Funnel exploration