
Gymshark launched 70 of its 72 live Meta ads in 48 hours. Hims has 428 live and not one says "% off".
Both facts were sitting in the public Meta Ad Library on 17 November 2026. Anyone could have seen them. Almost nobody writes them down, and the library won't do it for you: outside the EU, an ad vanishes from it the day it stops running. If you don't log your competitors every week, you never see their rhythm, only a single day.
This post is a ten-minute weekly routine and the sheet that goes with it. It logs five numbers per competitor, compares them with last week, and colours the rows worth a closer look. We've prefilled it with a real read of 10 DTC brands so you can see what a week looks like.
Why a sheet, and not the API or a spy tool
Meta does have an Ad Library API, but it covers ads about social issues, elections or politics, and ads delivered to the EU (Meta Transparency Center: Ad Library tools). If your competitors sell to the US only, their ordinary product ads aren't in it. The website shows them; the API doesn't.
Paid ad-intelligence tools can fill the gap, and for large teams they're worth it. But for most businesses, five numbers per competitor per week answers the questions that matter: are they launching, are they on sale, what have they kept, are they spending more? A sheet does that for free, and you see every ad with your own eyes.
The five numbers
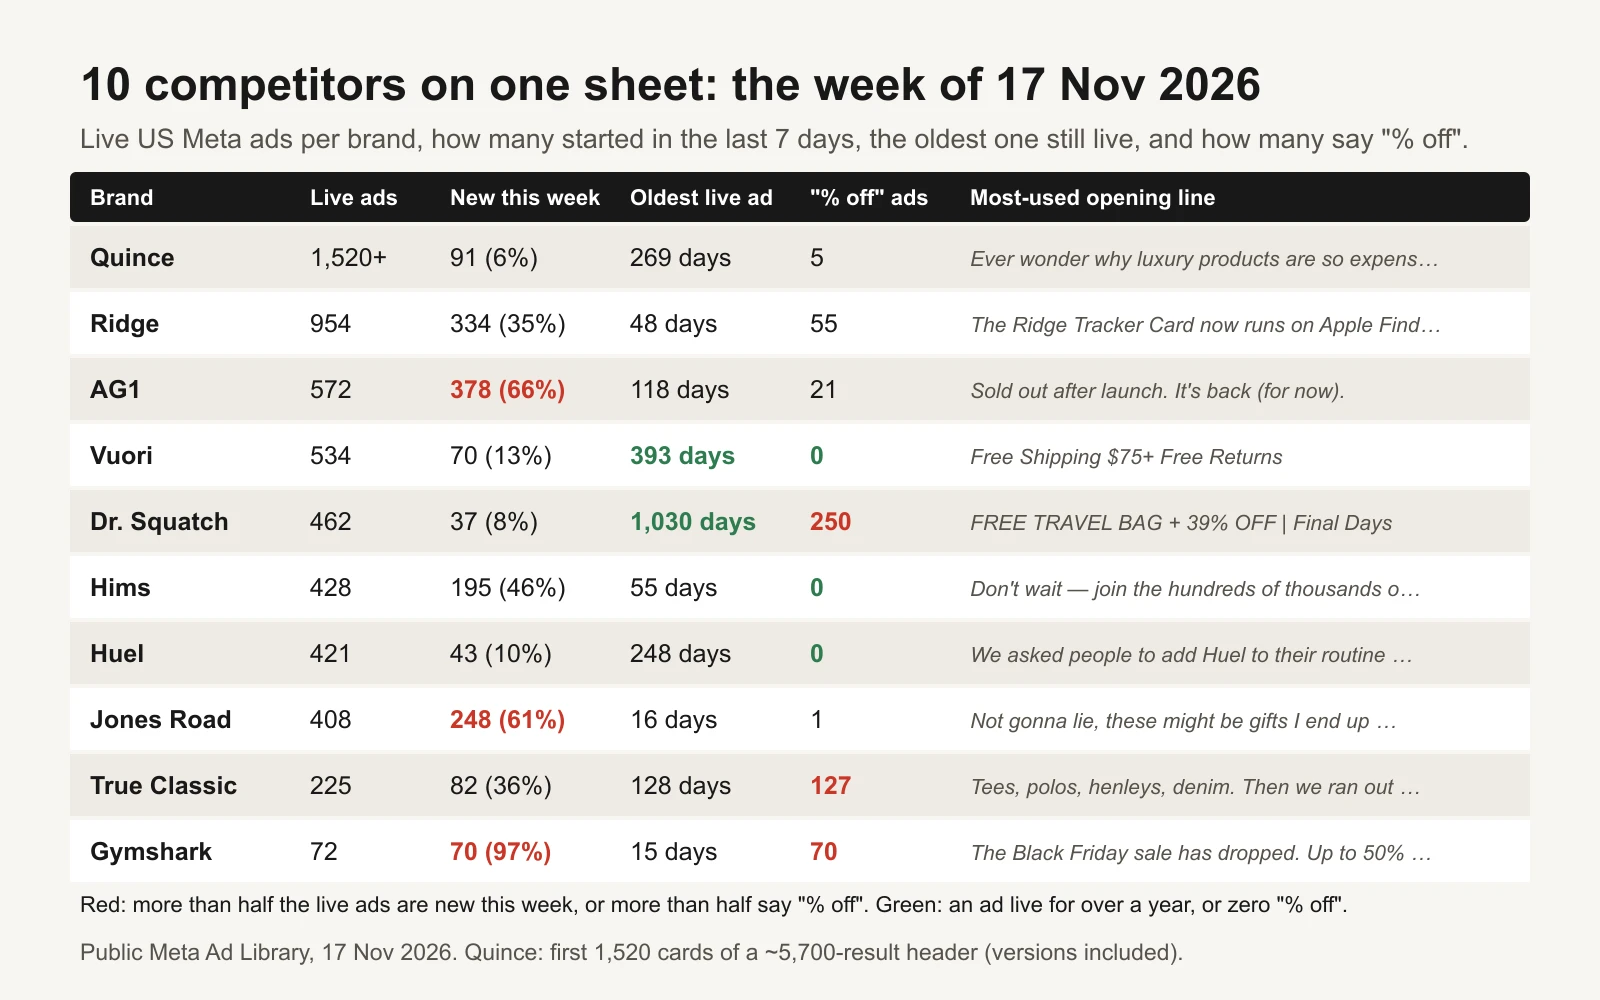
One week of the tracker: 10 DTC brands on 17 November 2026, from the public US Meta Ad Library.
For each competitor, once a week:
- Live ads. The number of ad cards when you scroll to the end of their page. (Not the "~N results" figure at the top: that counts versions of ads.)
- New this week. Ads whose "Started running on" date is 7 days or less before today.
- Oldest live ad. The earliest "Started running on" date you find. The sheet turns it into days.
- "% off" ads. Press Ctrl+F (Cmd+F on a Mac) on the page, search "% off" and count the ads that match.
- Most-used opening line. The first line you see on the most ads. Copy it word for word.
The real numbers from 17 November:
| Brand | Live ads | New this week | Oldest live ad | "% off" ads |
|---|---|---|---|---|
| Quince | 1,520+ | 91 | 269 days | 5 |
| Ridge | 954 | 334 | 48 days | 55 |
| AG1 | 572 | 378 | 118 days | 21 |
| Vuori | 534 | 70 | 393 days | 0 |
| Dr. Squatch | 462 | 37 | 1,030 days | 250 |
| Hims | 428 | 195 | 55 days | 0 |
| Huel | 421 | 43 | 248 days | 0 |
| Jones Road | 408 | 248 | 16 days | 1 |
| True Classic | 225 | 82 | 128 days | 127 |
| Gymshark | 72 | 70 | 15 days | 70 |
Together that's 5,596+ live ads. Quince's page is so large that our scan stopped at 1,520 ad cards of a header showing about 5,700 results, so its counts are "of the first 1,520". Do the same for any very large page: cap the count and mark it with a plus.
The four flags
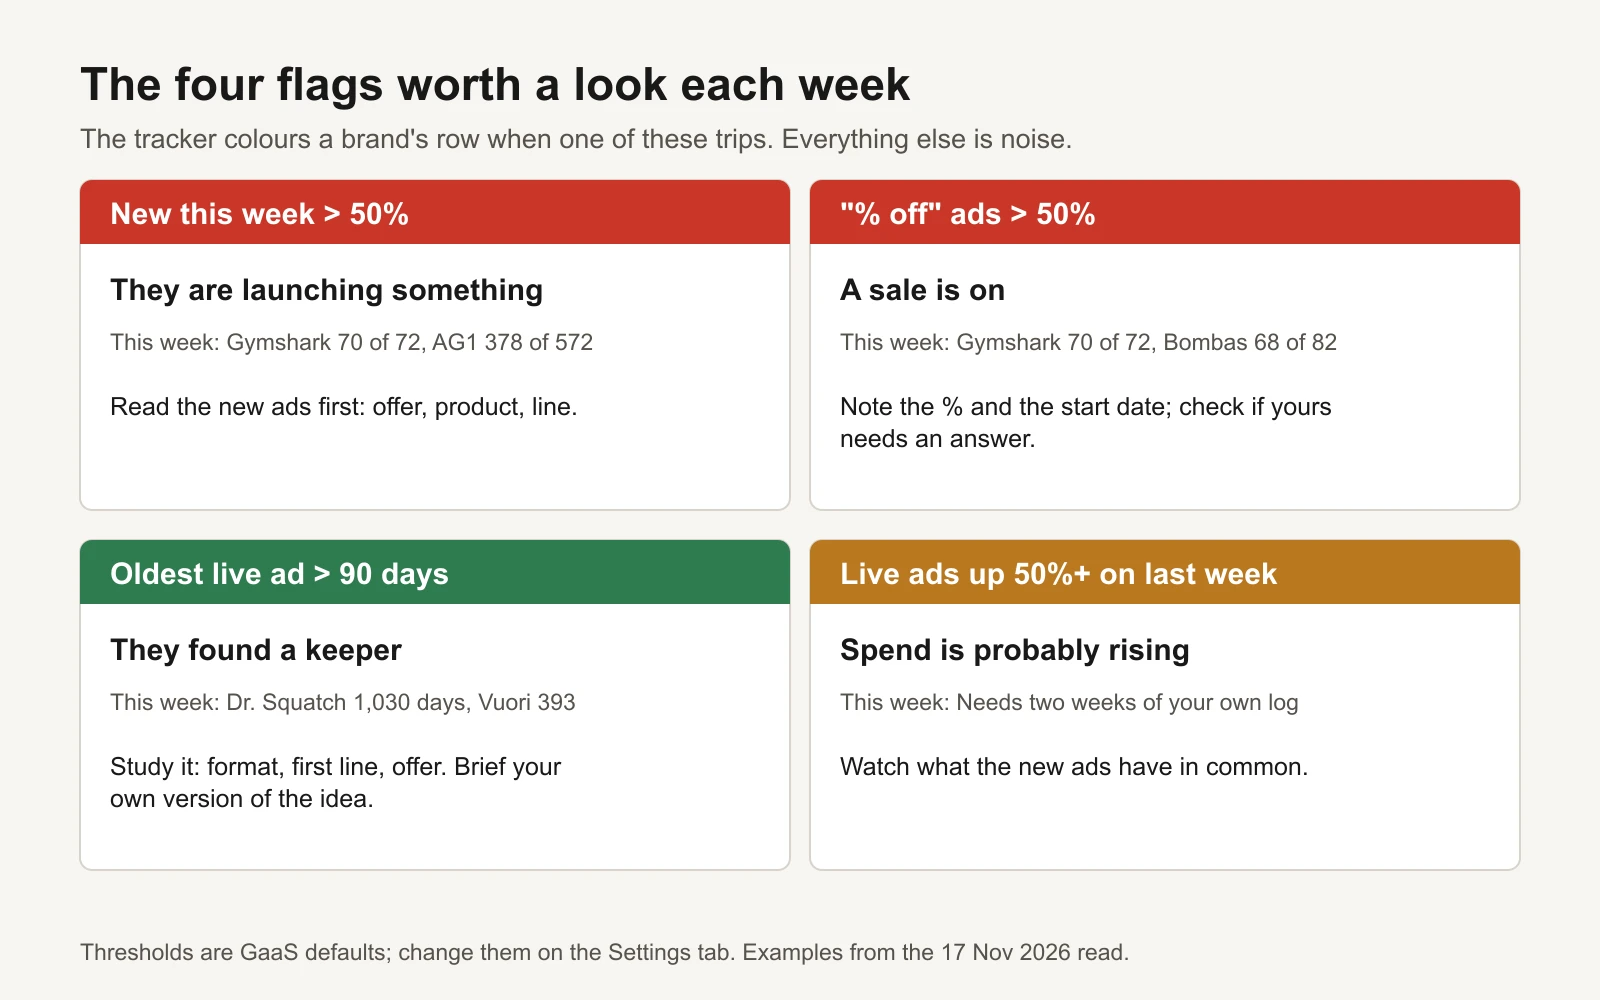
The thresholds are defaults; change them on the Settings tab.
Five numbers a week is still a lot to read. The sheet colours a brand's row when one of four things trips:
- Launching: more than half the live ads started this week. On 17 November that was Gymshark (70 of 72, launched 15 and 16 November), AG1 (378 of 572) and Jones Road (248 of 408; 235 started the day before). Read their new ads first: what product, offer and line are they pushing?
- Sale on: more than half the ads say "% off". Gymshark (70 of 72) and Dr. Squatch (250 of 462) were there; True Classic was close (127 of 225). Note the percentage and when it started, and decide whether you need an answer. Not necessarily a discount: Hims's 428 ads had no "% off" and 195 offered free shipping.
- Keeper live: an ad has run for more than 90 days. Dr. Squatch's oldest live ad has run 1,030 days, and it's a "Thanks for ordering" welcome video, not a sale. Vuori has two at 393 days. These are the ads a brand keeps paying for. Study the idea, then brief your own version.
- Growing fast: live ads up 50% or more on last week. This needs two weeks of your own log, which is why the routine matters more than any single read. A jump in ad count usually means more budget or a new campaign.
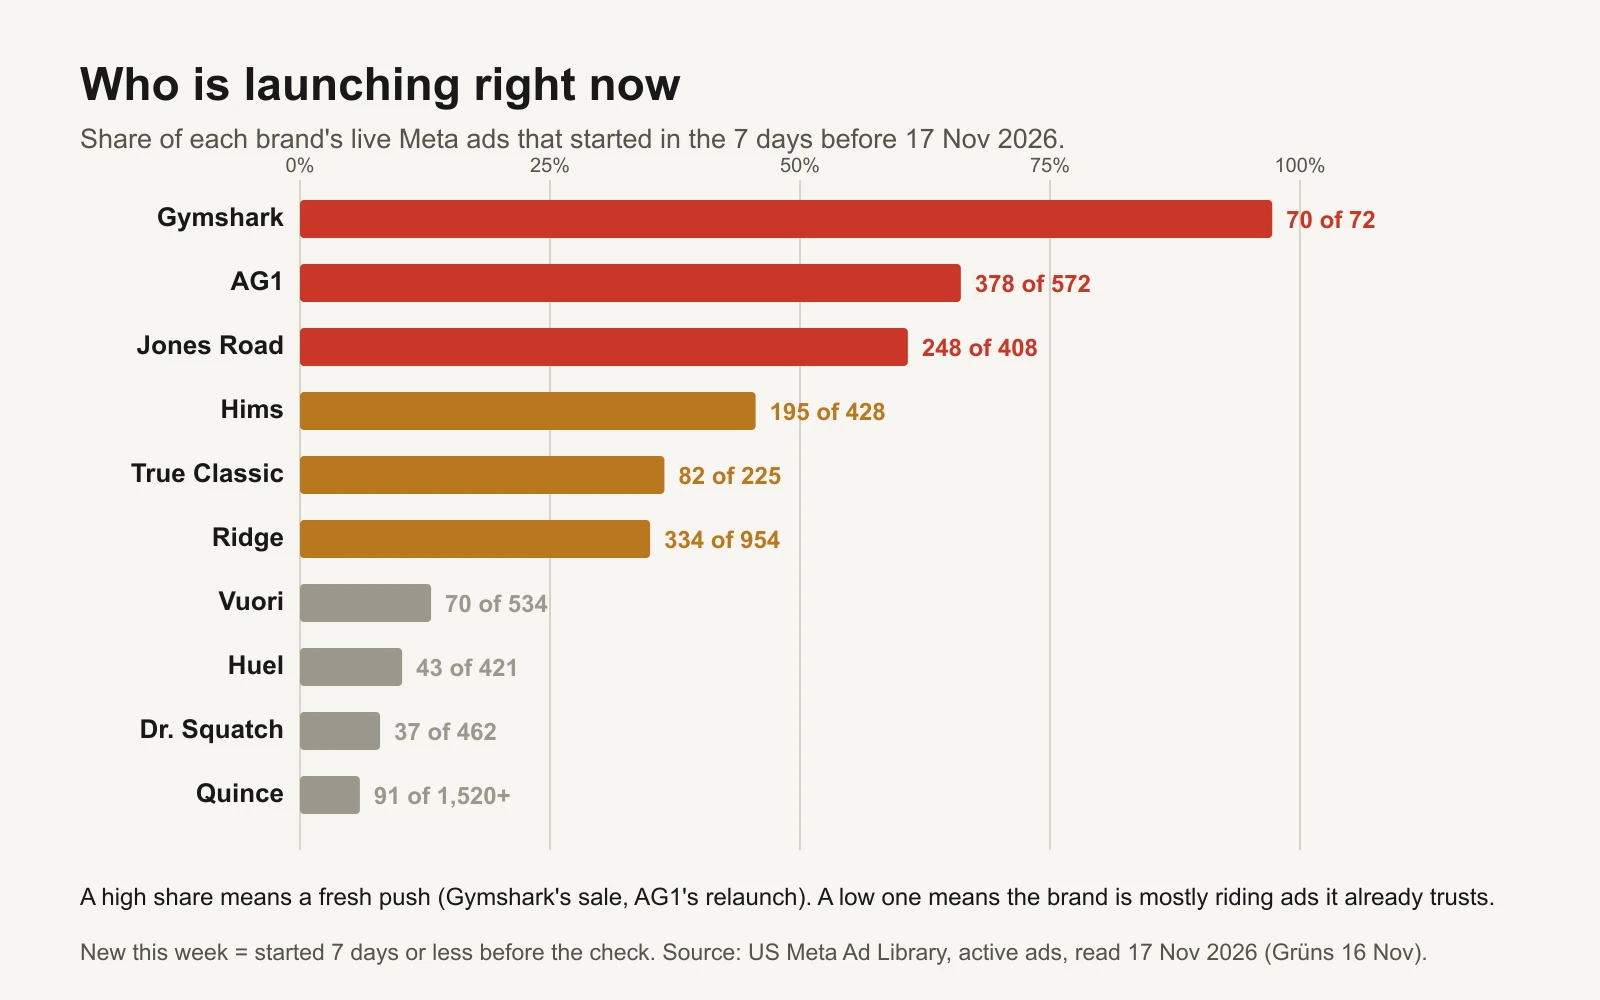
Who was launching in the week before 17 November 2026.
"Not one discount" deserves the same care. The sheet counts "% off" in the ad copy. That misses bundles, gifts, free shipping and offers shown only in the image, so read a zero as "no '% off' in the copy". Our Black Friday discount count across 21 brands goes into what the zero-discount brands offer instead.
The ten-minute routine
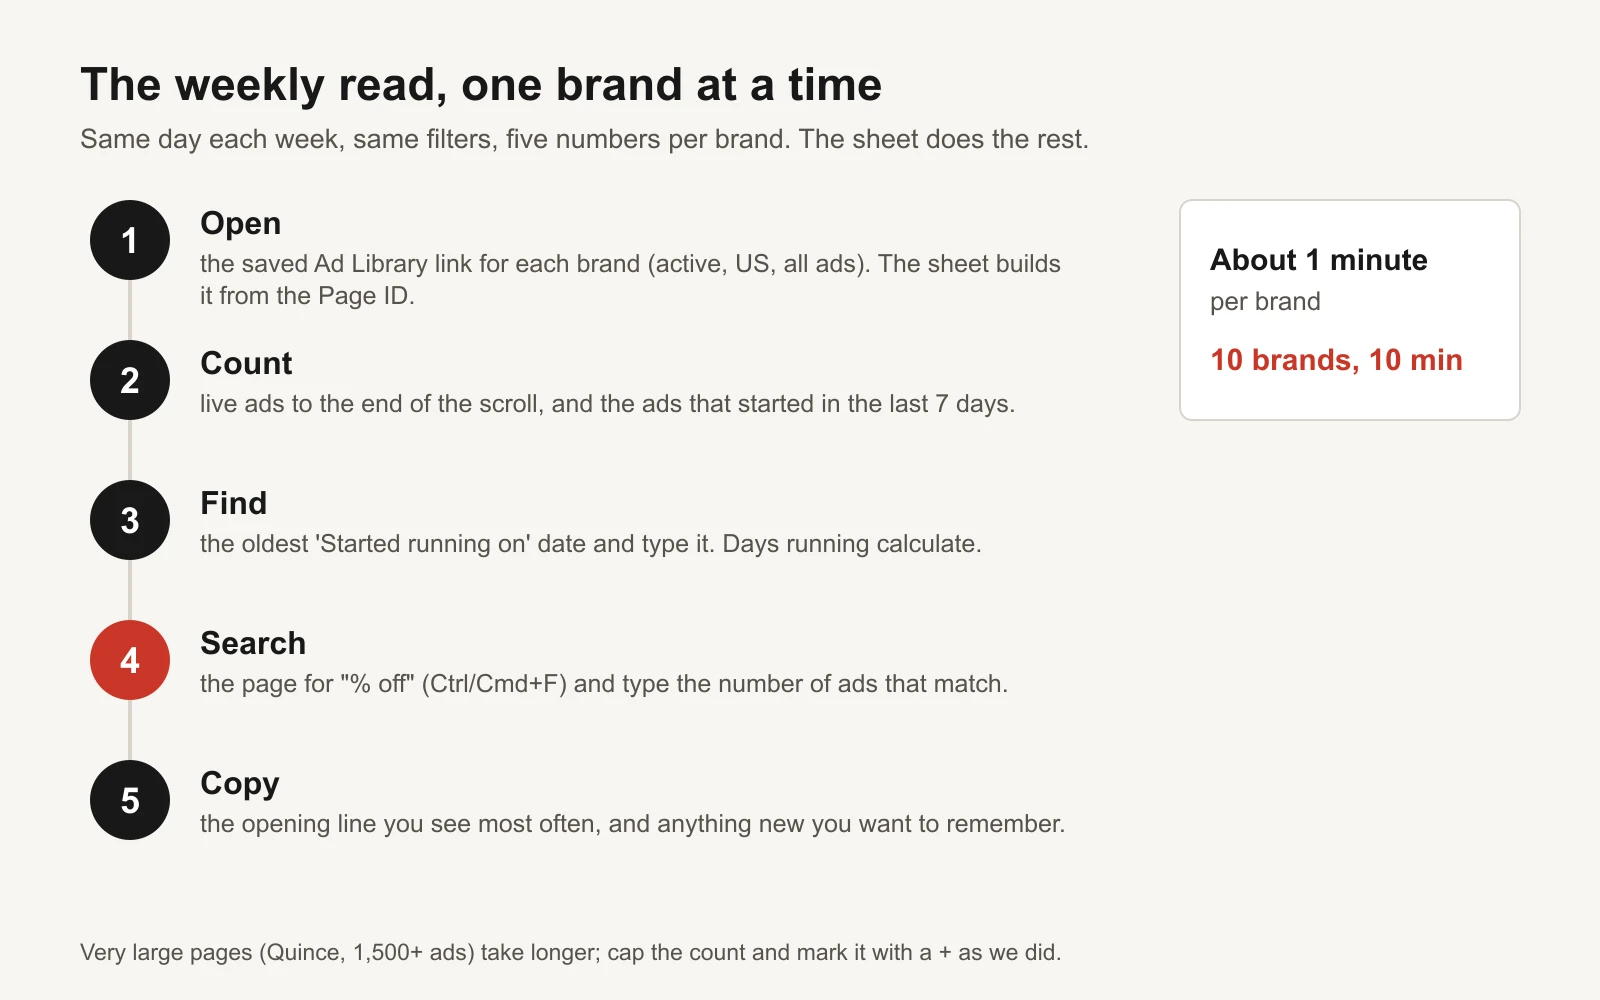
Same day each week, same filters.
- Set up once. On the Brands tab, replace the examples with your competitors and their Facebook Page IDs. The ID is the number after
view_all_page_id=in the URL when you open their page in the Meta Ad Library. The sheet builds a link with active ads, the US and all formats selected; changecountry=USif you sell elsewhere. - Pick a day. Monday morning works. Reading on the same weekday keeps "new this week" comparable.
- One row per brand. On the Weekly log, add the date, the brand and the five numbers. Write anything unusual in Notes ("new product", "creator ads", "sale started Friday").
- Read the Dashboard. It shows this week for each brand, the change on last week and the flags. Spend your remaining minutes on the flagged rows.
- Go deeper only when a row flags. The Ad log tab is for logging individual ads (Library ID, start date, format, offer, opening line) when you want to study a launch or a keeper properly. The Ad Library competitor playbook shows how to turn what you find into briefs of your own.
Two cautions. The library shows no spend, sales or results for these ads, so the tracker tells you what competitors run, not what works for them. And it's a research tool, not a copy machine: use your own product, words and proof.
What's in the workbook
- Settings: this week's and last week's check dates, and the four flag thresholds.
- Brands: your competitors and their Page IDs, with the Ad Library link built for you.
- Weekly log: one row per brand per week, prefilled with the 10 brands above. New share, "% off" share, last week's count, the change and the flags calculate. Two fictional "Example Co" rows show the week-on-week flag working.
- Dashboard: this week per brand with flags, total live ads tracked, and a chart of who is launching.
- Ad log: individual ads for a closer read, starting with Dr. Squatch's 1,030-day welcome video and Gymshark's only older ad.
Tools and repos that help
| Tool or repo | What it is for | Who should use it |
|---|---|---|
| Meta Ad Library | Every live ad for a Page, with start dates, formats and versions | Everyone; the tracker is built on it |
| Meta Transparency Center: Ad Library tools | What the library keeps and what the API covers | Anyone deciding between the website and the API |
| facebookresearch/Ad-Library-API-Script-Repository | Meta's Python examples for the Ad Library API | Developers tracking competitors who advertise in the EU |
| anthropics/skills | Public agent skills, including an xlsx skill that lets Claude read and update spreadsheets | Anyone who wants an assistant to summarise the weekly log |
Or let GaaS run it
GaaS is an AI agent that creates, launches and optimizes Meta and Google ads from three inputs: your website, a spend limit and a one-line goal. It researches what's working in your market, writes ads in batches, tests them and keeps what earns, and nothing spends without your approval. See how GaaS works. Either way, the tracker is yours to keep.