
You need 45 ads to find one winner.
That number surprises most business owners, because the usual plan is "let's test three new ads this week". Three ads feels like a test. At the hit rate a large benchmark study found, it is a 14% chance of finding a single winner.
This guide shows where the 45 comes from, how it changes with your account size, what it costs, and how to work out your own number instead of borrowing anyone's. It is written for business owners who run Meta ads (Facebook and Instagram), with enough detail for a performance marketer to set a weekly testing target.
The workbook has a Calculator tab (hit rate, how sure you want to be, spend per test ad and your weekly pace in; ads needed, budget, weeks and your odds this month out), an Odds table with a chart, a Test log that works out your own hit rate from past ads, and Motion's benchmark figures. Numbers in this article are a fictional worked example unless a source is linked.
The number: about 5% of new ads win
Motion, the creative analytics company, published its 2026 Creative Benchmarks from 578,750 creatives across 6,015 advertiser accounts and $1.29 billion of Meta spend. Its headline finding is that roughly 5% of creatives became winners (Motion: Winners are rare).
Before you use that number, read Motion's definition. A winner is a creative that spent at least 10 times its account's median ad spend, and at least $500. In other words, an ad Meta's delivery system chose to put a lot of money behind. Motion says spend, not ROAS, is the success metric; it does not check whether winners were profitable.
That is a reasonable proxy. Meta moves budget towards ads that get results at the price you allow, so the ads it scales are usually the ones doing the work. But it is not proof of profit. This guide uses "winner" in Motion's sense: an ad Meta scaled. Check profit with your own rule before you scale it further (our Kill / Hold / Scale rulebook gives one built from your margin).
The maths: three ads is a 14% chance
If each new ad has a 5% chance of becoming a winner, the chance that a given ad doesn't win is 95%. The chance that none of n ads wins is 0.95 multiplied by itself n times. So:
Chance of at least one winner in n ads = 1 − (1 − hit rate)ⁿ
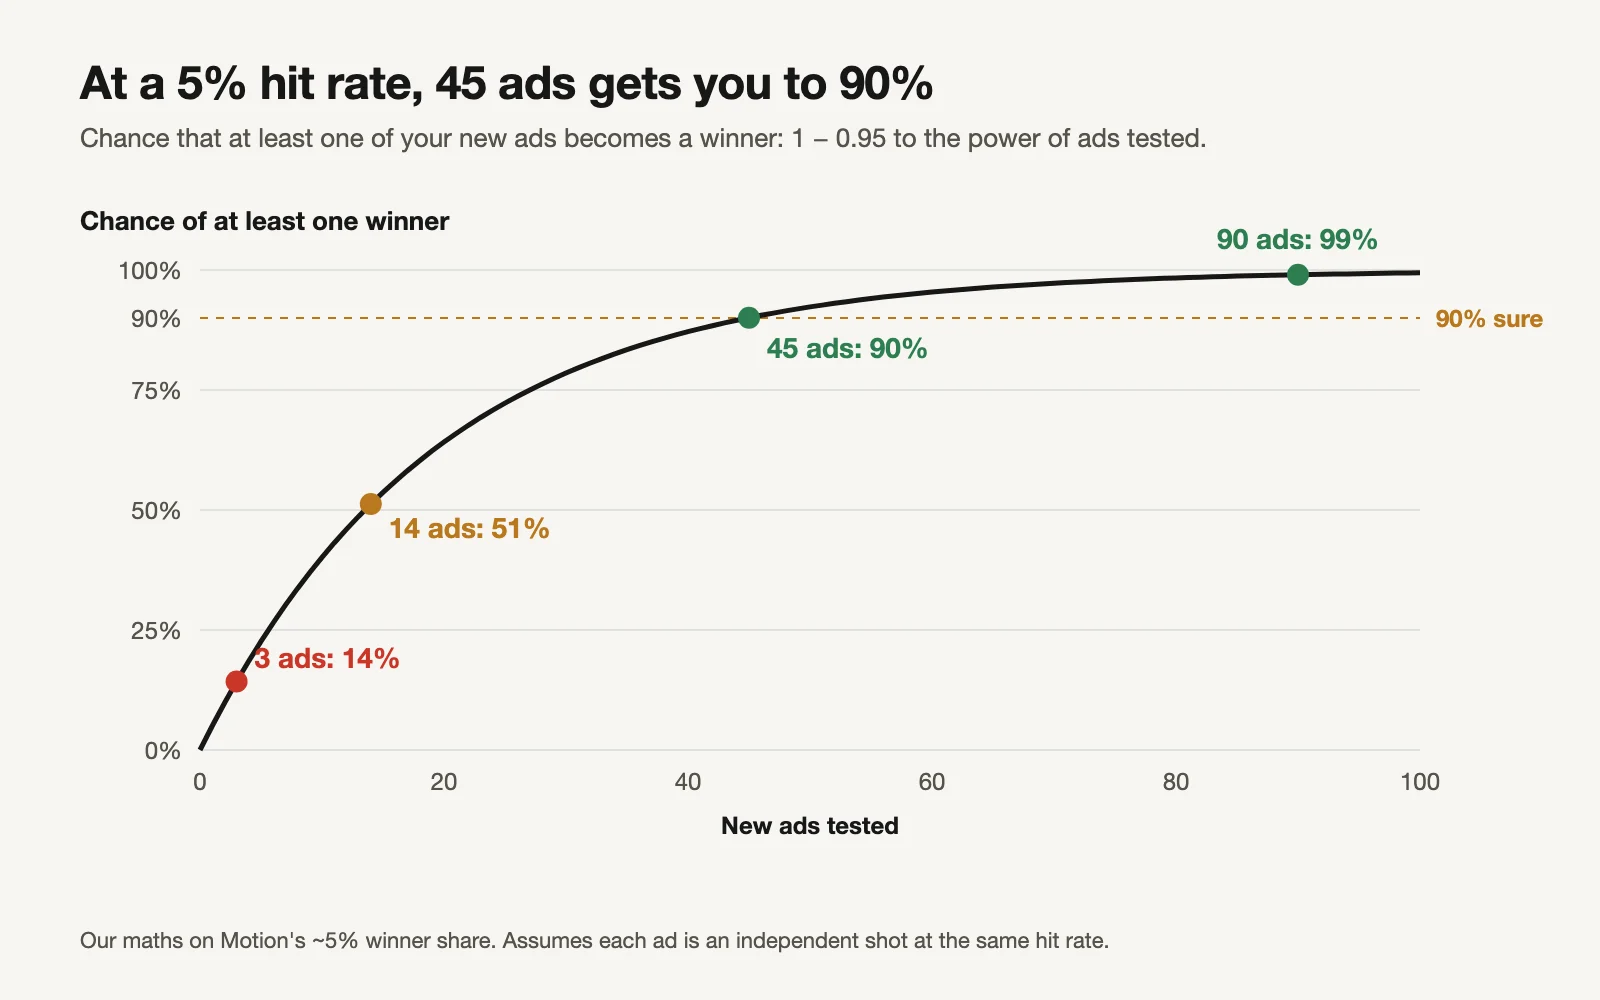
At 5%: 3 ads is a 14% chance, 14 ads is a coin flip, 45 ads is 90%, 90 ads is 99%.
| New ads tested | Chance of at least one winner (5% hit rate) |
|---|---|
| 3 | 14% |
| 5 | 23% |
| 10 | 40% |
| 14 | 51% |
| 20 | 64% |
| 30 | 79% |
| 45 | 90% |
| 60 | 95% |
| 90 | 99% |
To go the other way, from "how sure do I want to be" to "how many ads":
Ads needed = ln(1 − how sure you want to be) ÷ ln(1 − hit rate), rounded up
At 5% and 90% sure, that is ln(0.1) ÷ ln(0.95) = 44.9, so 45 ads.
Two things people get wrong here:
- "1 in 20 means 20 ads finds one." On average, yes: 20 is the average number of ads per winner. But averages hide the spread. After 20 ads you have a 64% chance, not a sure thing. One account in three will still be waiting.
- "We tested 10 and none won, so our ads are bad." At 5%, 10 ads with no winner happens 60% of the time. Ten losers in a row is normal, not a verdict.
Your number depends on your account size
Motion broke the winner share down by how much each account spends a month (Motion: Portfolio breakdown by tier). Bigger accounts hit more winners, but the gap is smaller than you'd guess.
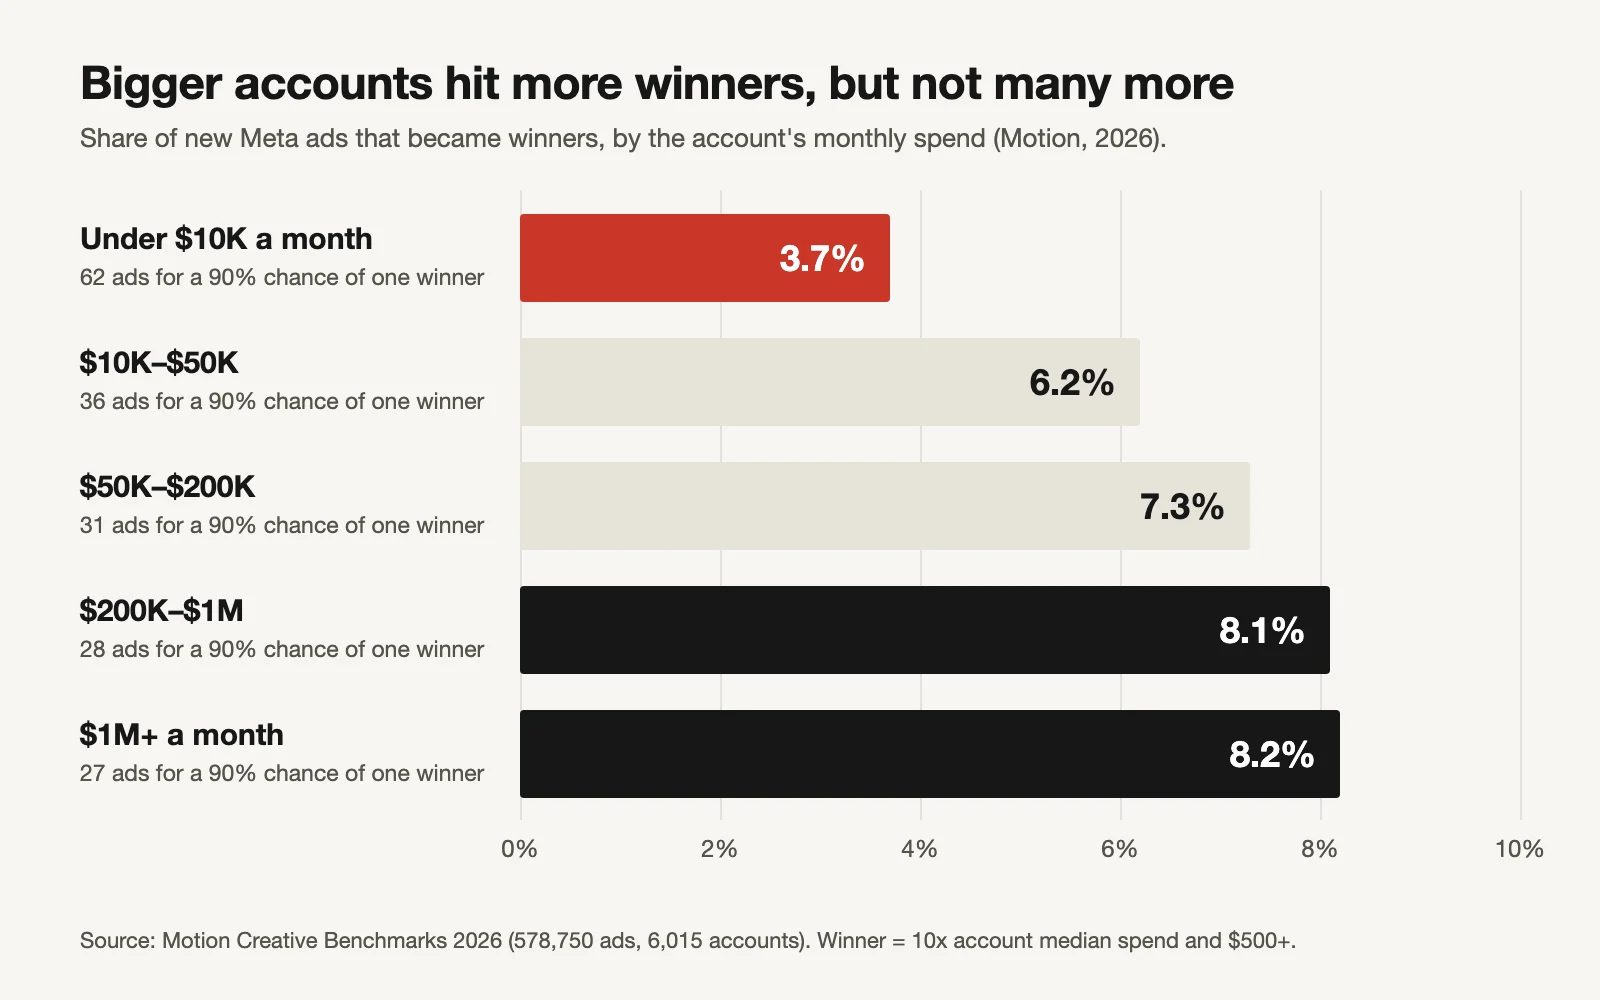
Source: Motion. The "ads for 90%" labels are our maths.
| Monthly Meta spend | Winner share (Motion) | Ads for a 90% chance of one winner |
|---|---|---|
| Under $10K | 3.7% | 62 |
| $10K–$50K | 6.2% | 36 |
| $50K–$200K | 7.3% | 31 |
| $200K–$1M | 8.1% | 28 |
| $1M+ | 8.2% | 27 |
The smallest accounts have the lowest hit rate and the smallest budgets, so they need the most tests and can afford the fewest. That is the trap. Motion's "winners are rare" page rounds the small-account figure to about 3.8%; we use the tier table's 3.7%.
Why would bigger accounts hit more often? Motion doesn't say, and we won't guess at a cause. Part of it is likely the definition: in an account with more money moving, it is easier for one ad to reach 10 times the median. Treat the tiers as a starting point, then replace them with your own hit rate as soon as you have one.
How sure do you need to be?
90% is a sensible default, but you can choose. Here is the full grid at three hit rates.
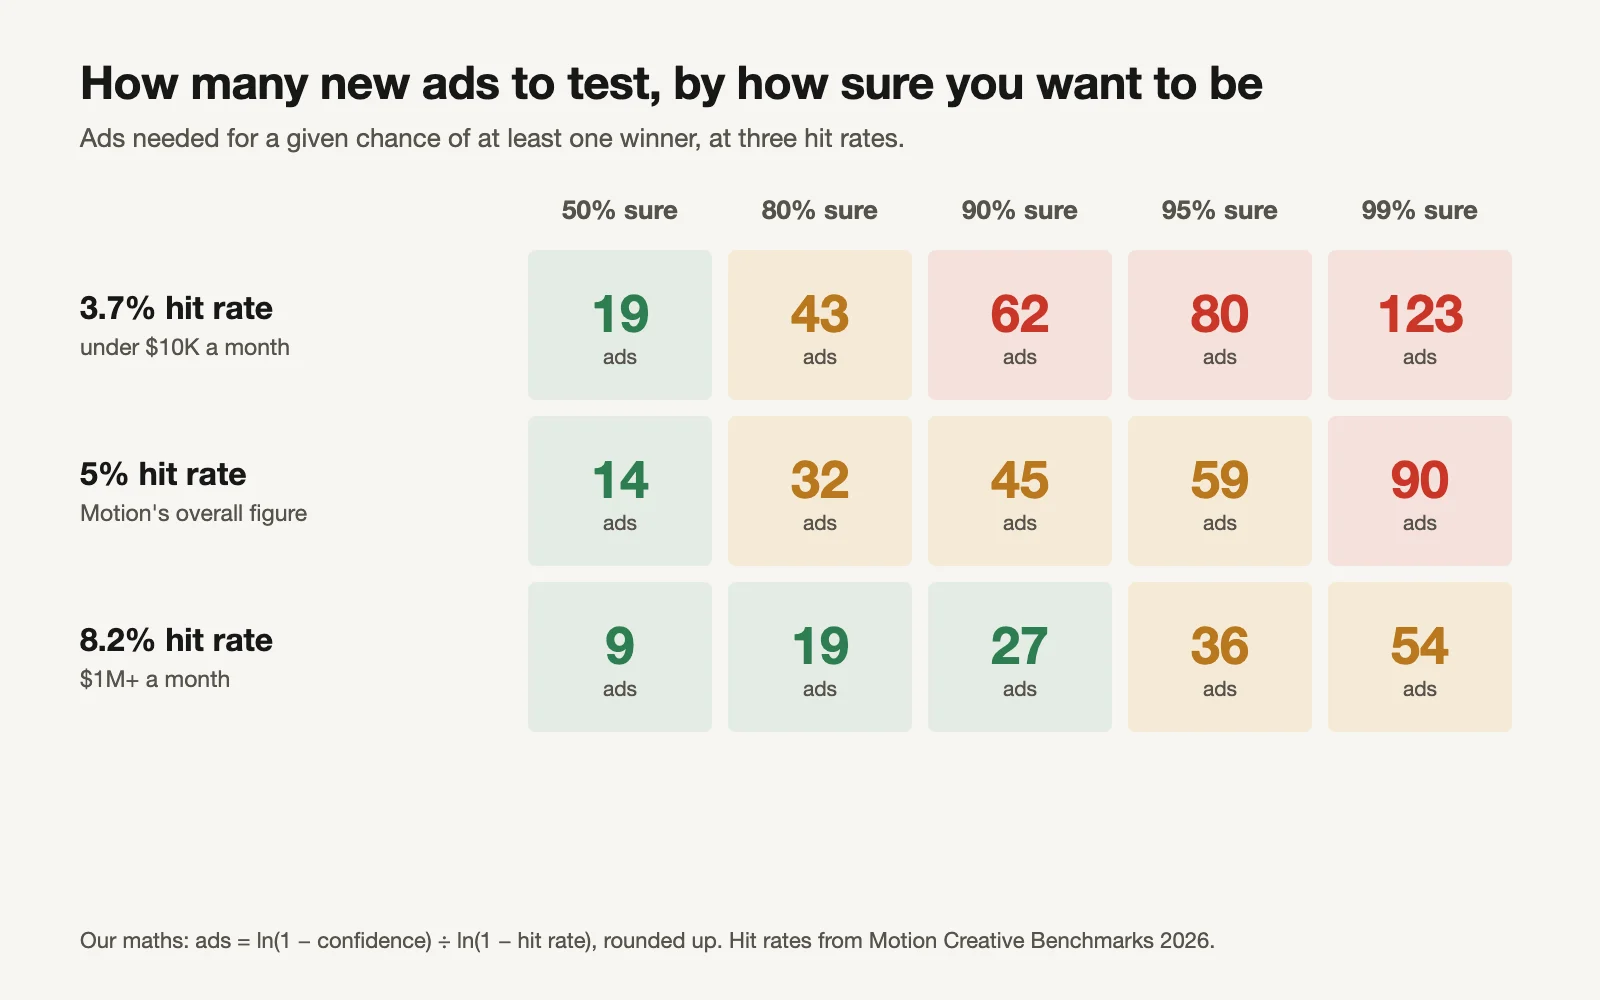
Our maths on Motion's hit rates.
Going from 90% to 99% sure doubles the ads at every hit rate. For most small brands, 80–90% is the useful range: high enough that a month without a winner tells you something, low enough to afford.
What it costs, and how long it takes
The calculator turns ads into money and weeks. You give it two numbers of your own:
- Test spend per new ad: how much each new ad gets before you judge it. This comes from your testing rule, not from this guide. Our creative testing calculator works it out from your target cost per purchase.
- New ads per week: your real pace, not your plan.
Worked example (fictional): a store with a 5% hit rate gives each new ad $100 of test spend.
| Number | Formula | Example |
|---|---|---|
| Ads for a 90% chance | ln(0.1) ÷ ln(0.95), rounded up | 45 |
| Test budget | 45 × $100 | $4,500 |
| Weeks at 5 new ads a week | 45 ÷ 5 | 9 weeks |
| Chance of a winner in the next 4 weeks | 1 − 0.95^(4 × 5) | 64% |
| Winners to expect per month | 4 × 5 × 5% | 1.0 |
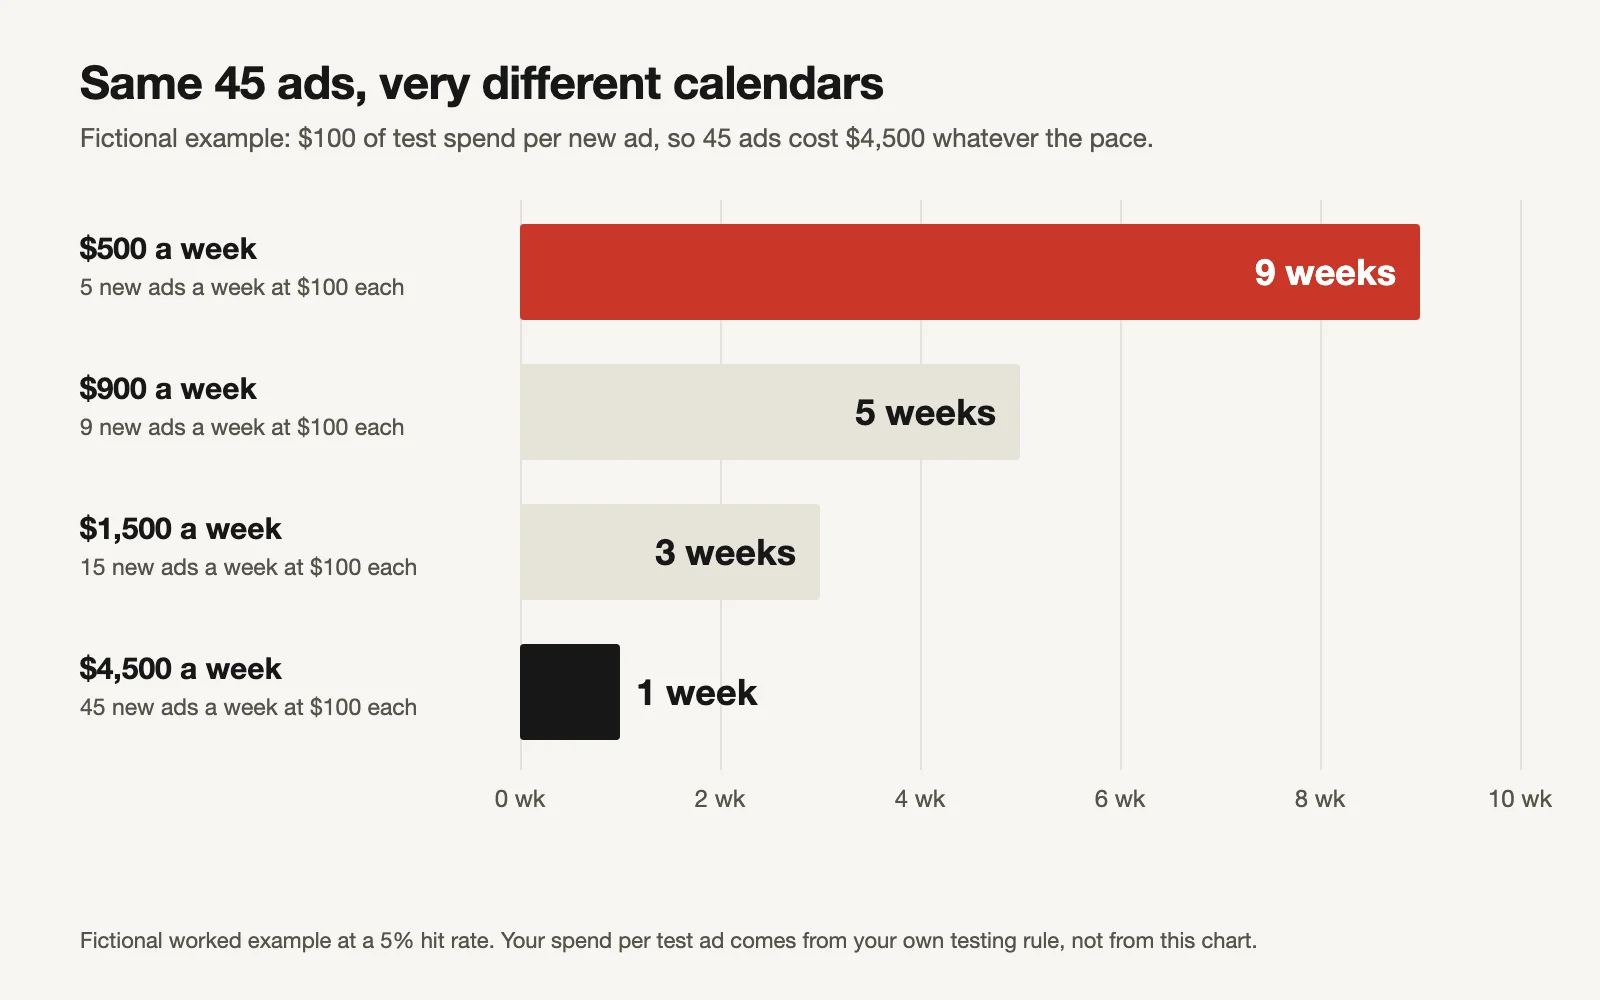
Fictional example. The budget is the same; only the calendar changes.
Notice what the chart says. The total is the same $4,500 whichever pace you choose. What changes is how long you wait. At five ads a week, the expected winner arrives in about two months, and your current best ad may be tired by then (see our creative fatigue system for how to plan around that).
If the money is the problem, you have three honest levers:
- Spend less per test and accept noisier verdicts. Cut obvious losers early, but don't crown winners on a handful of sales.
- Make cheaper ads. A new hook on a proven body costs less than a new shoot.
- Raise your hit rate. This is the one that compounds, and it is where the 45 stops being a law.
Why your real number should be better than 45
The formula treats every ad as an independent shot at the same odds, like rolling a die. Real testing isn't like that, and it shouldn't be.
A team that learns from each round, writes the next brief from what lost and what came close, and retests near-winners (how to retest a near-winner) is not rolling the same die. Its hit rate climbs. A team that tests random ideas, or ten colour swaps of one idea, can do worse than the benchmark, because the "different" ads aren't different.
So use 45 as a planning floor for a team that isn't learning yet, and measure your own number.
Find your own hit rate
The workbook's Test log does this. Paste in every new ad you've tested with its lifetime spend (Ads Manager, ad level). It then:
- Works out your median spend per ad.
- Marks a Motion-style winner when an ad spent at least 10 times that median and at least $500 (you can change both).
- Divides winners by ads logged: your hit rate.
- Optionally, you mark which winners were profitable by your own rule. It then gives a stricter "your hit rate" that counts only scaled ads that also made money.
Worked example (fictional): 40 logged ads, median spend $155. Two ads spent more than $1,550 ($4,200 and $2,650), so the Motion-style hit rate is 2 ÷ 40 = 5%. Only one of those two was profitable, so the stricter rate is 2.5%, and at that rate a 90% chance needs 91 ads. That gap is the reason to check profit, not just spend.
With fewer than about 40 logged ads, one extra winner moves the rate a lot. Use Motion's tier until your own log is bigger, then switch the calculator's source to "My own".
Set your weekly testing pace
Turn the numbers into a routine:
- Choose your hit rate: your tier from Motion's table, or your own from the Test log.
- Choose how sure you want to be in a month: 80–90%.
- Read "New ads to test" and divide by 4: that's your weekly target for a monthly winner.
- Check the weekly test spend is affordable. If not, use the three levers above.
- Launch new ads in one batch a week, not one a day.
- Every month, update the Test log and re-run the calculator with your own hit rate.
At a 5% hit rate, a winner a month at 90% confidence means about 11 to 12 new ads a week (45 ÷ 4). That's the honest maths behind "test more creative".
Or let GaaS make the volume
GaaS is an AI agent that creates, launches and optimises Meta and Google ads from three inputs: your website, a spend limit and a one-line goal. Making 10+ genuinely different ads a week is the part most small teams can't staff; the agent writes and builds them, tests them inside your spend limit, and learns from each round so the next batch is better aimed. We have made more than 60,000 ads this way. If you'd rather run it yourself, the workbook does the maths.
Limits of this calculator
- "Winner" means Meta scaled it. Motion's definition is about spend, not profit. Your stricter hit rate (scaled and profitable) will be lower.
- The odds assume independent tests. A team that learns between rounds should beat them; a team testing near-copies will do worse.
- Motion's sample is Motion's customers. Brands that pay for creative analytics may test differently from the average small business.
- Hit rates move with your product, offer and season. Re-run the calculator monthly.
- Your test spend per ad decides how reliable each verdict is. This calculator doesn't set it; the creative testing calculator does.
Sources
- Motion, Creative Benchmarks 2026: Winners are rare (578,750 creatives, 6,015 accounts, $1.29B Meta spend; winner definition) and Portfolio breakdown by tier (winner share by spend tier). Read 17 November 2026; older motionapp.com links now redirect to these pages.
- All odds, ads-needed figures and worked examples: GaaS calculations.