
Stop typing "how are my ads doing?" into ChatGPT.
The AI can't see your account. It doesn't know your margin, what a good cost per purchase is for you, or which date range you mean. So it fills the gap with general advice: test more creative, watch your frequency, consider broad targeting. None of it is wrong, and none of it tells you where your money went last month.
The fix isn't a smarter AI. It's a narrower question and the right file. This guide gives you 25 audit prompts that work in Claude, ChatGPT and Grok. Each one asks one question, names the exact Ads Manager export that can answer it, and tells the AI to use only that file and show its sums. It is written for business owners who run their own Meta ads (Facebook and Instagram), and it's specific enough for a performance marketer to hand to a junior.
The workbook has the 25 prompts with your business, targets and date range filled in automatically, the steps for each export, a Check tab that re-does the AI's sums with formulas, and a log for what you find. The account numbers in this article are a fictional worked example; nobody's real account was audited for it.
Why the vague question fails
Ask "how are my ads doing?" and three things are missing:
- The data. Without a file the AI has nothing to read. With a file but no instruction, it picks whatever columns look interesting.
- The yardstick. "Good" or "bad" only means something against your target cost per purchase and your break-even ROAS (return on ad spend). Leave them out and the AI compares you with averages it half-remembers.
- The rules. Nothing stops it rounding, estimating a missing column or inventing a benchmark. It will sound just as confident either way.
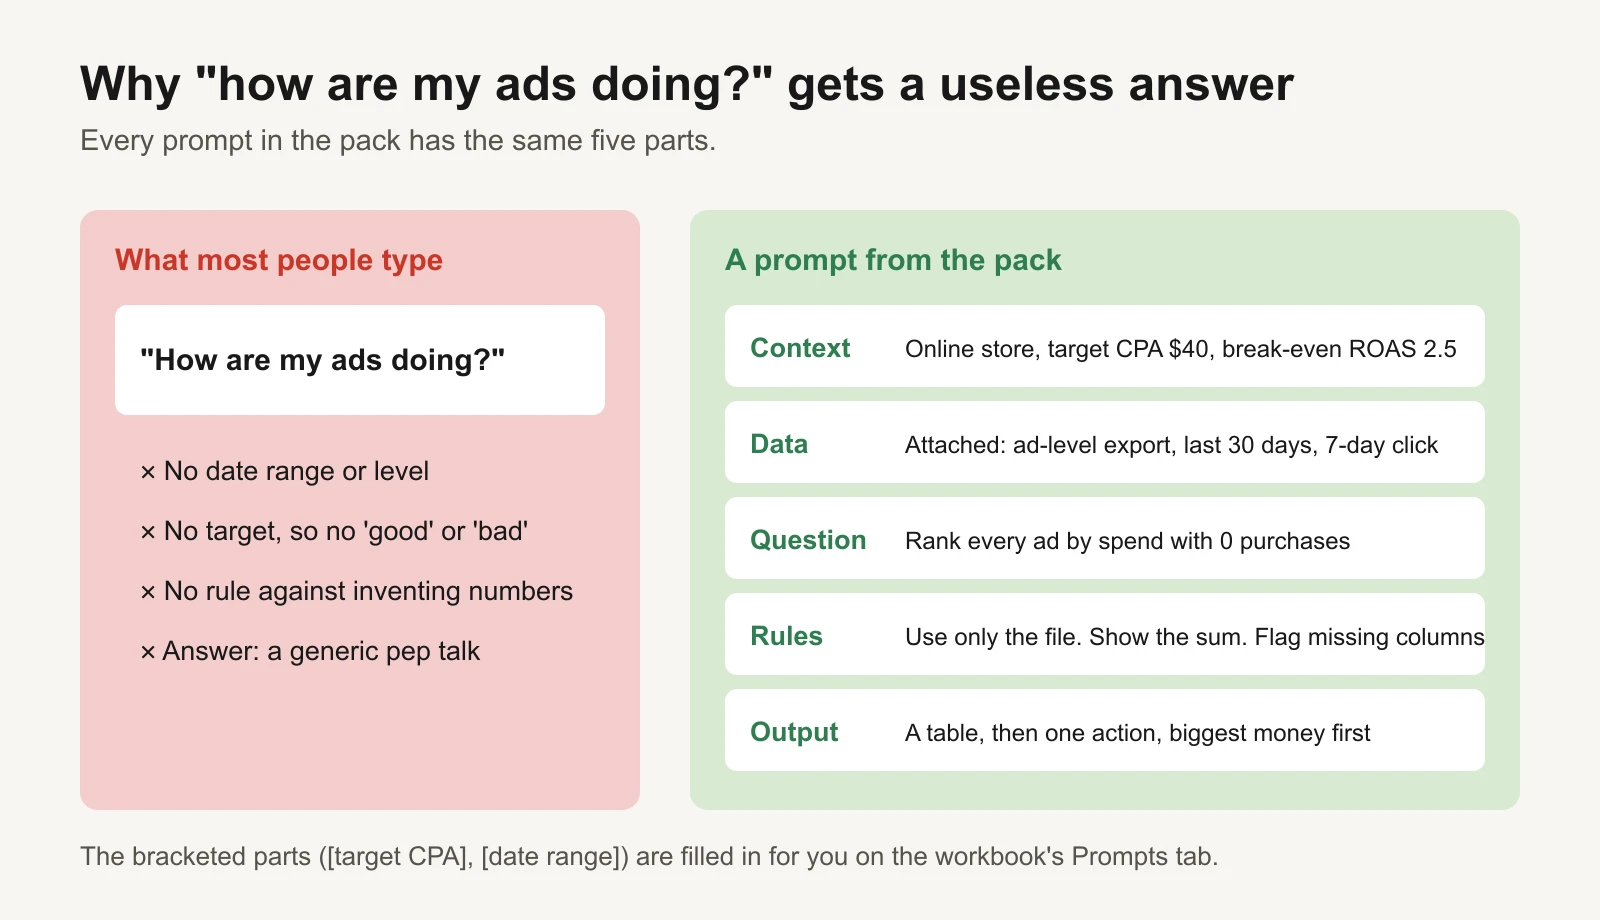
Every prompt in the pack has the same five parts.
The template every prompt uses
Here is the full prompt behind prompt 1, with our example settings. The workbook builds all 25 this way from your own Settings tab.
I run an online store selling coffee subscriptions. Target cost per purchase: $40. Break-even ROAS: 2.5. Target ROAS: 3.3. Attached: Ad level · last 30 days · Amount spent, Purchases, Purchase conversion value (last 30 days, attribution 7-day click, 1-day view, USD). Task: List every ad with zero purchases, sorted by amount spent, and give the total spent on them. Mark the ones that spent more than 1.5 times my target cost per purchase. Rules: Use only the attached file. Show the numbers and the sum behind every claim. If a column you need is missing, name it and stop; don't guess or estimate it. Answer with a table first, then one action per finding, biggest money first.
Three settings matter most:
- Target cost per purchase: the most you want to pay for one sale.
- Break-even ROAS: 1 ÷ your margin after product cost, shipping and fees. A 40% margin breaks even at 2.5. The ROAS target calculator works it out with returns included.
- Attribution setting: the window Ads Manager uses to credit purchases (7-day click, 1-day view is the usual default). Say which one the export uses so the AI doesn't mix them.
How to run it
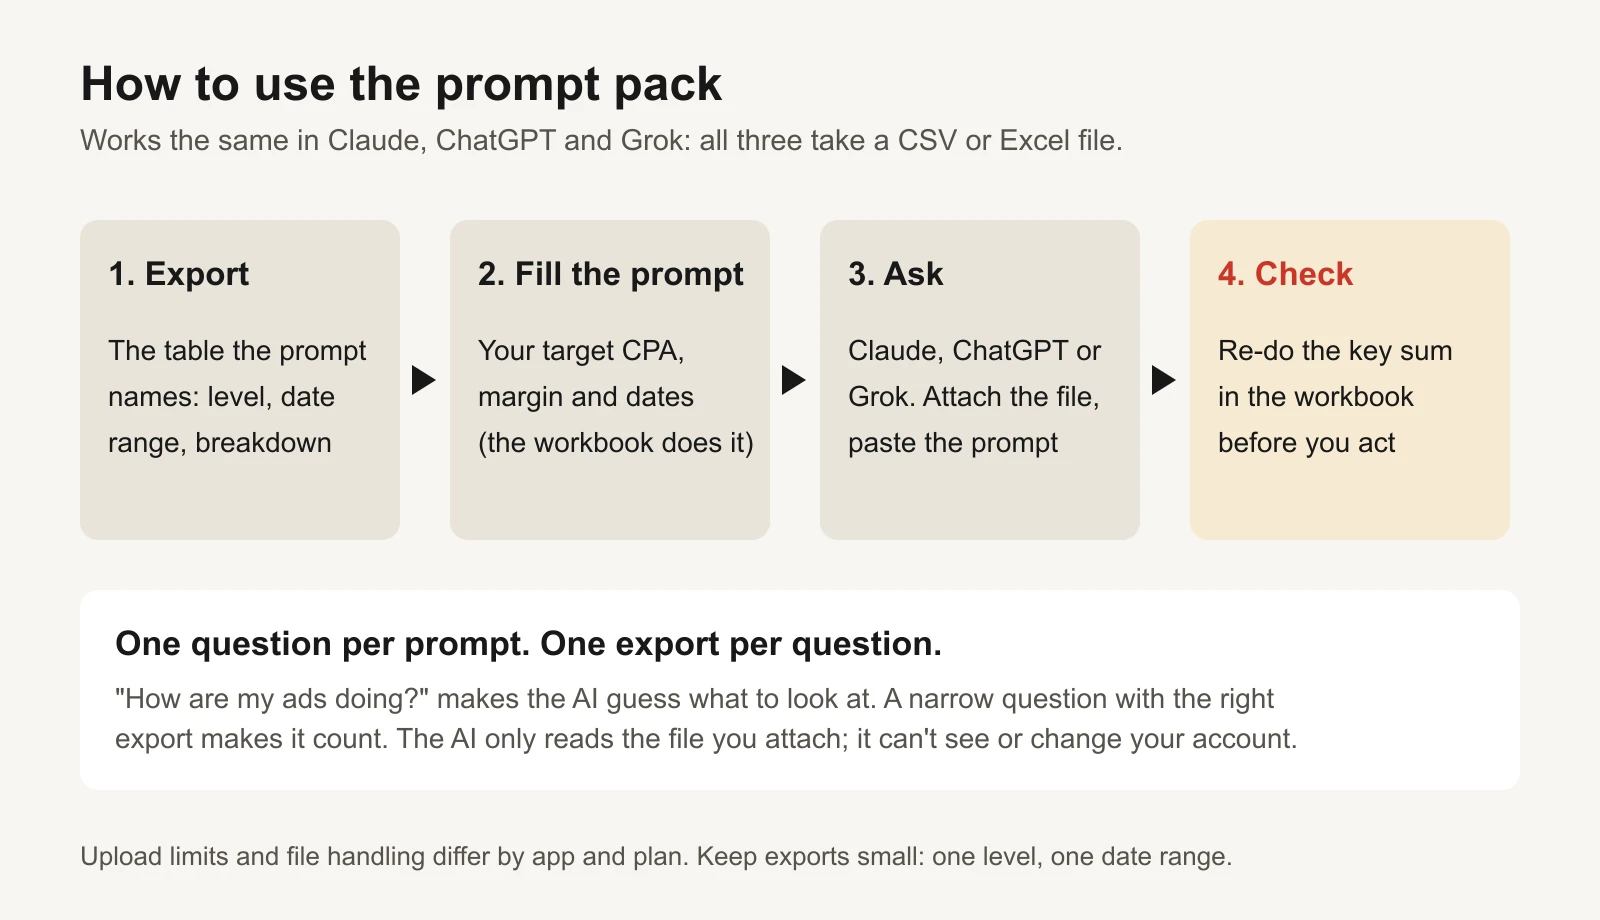
- Export the table the prompt names. Ads Manager exports the table you're looking at, with your filters, columns, breakdown and date range applied, as CSV or Excel. Select the rows, then use Export table data. We couldn't find a Meta Help Center page that spells this out; third-party guides such as this one from Coinis walk through it.
- Paste the filled-in prompt from the workbook's Prompts tab.
- Attach the file and send. Claude, ChatGPT and Grok all accept CSV and Excel uploads. Upload limits differ by app and plan, so keep each export small: one level, one date range.
- One prompt per message, same chat. Prompt 25 summarises the answers above it, so run it last in the same conversation.
All three AIs only read the file you attach. They can't log in to your ad account and can't change anything in it.
Six exports cover all 25 prompts
You don't need 25 exports. Ten prompts run on the same ad-level table, so pull that one first.
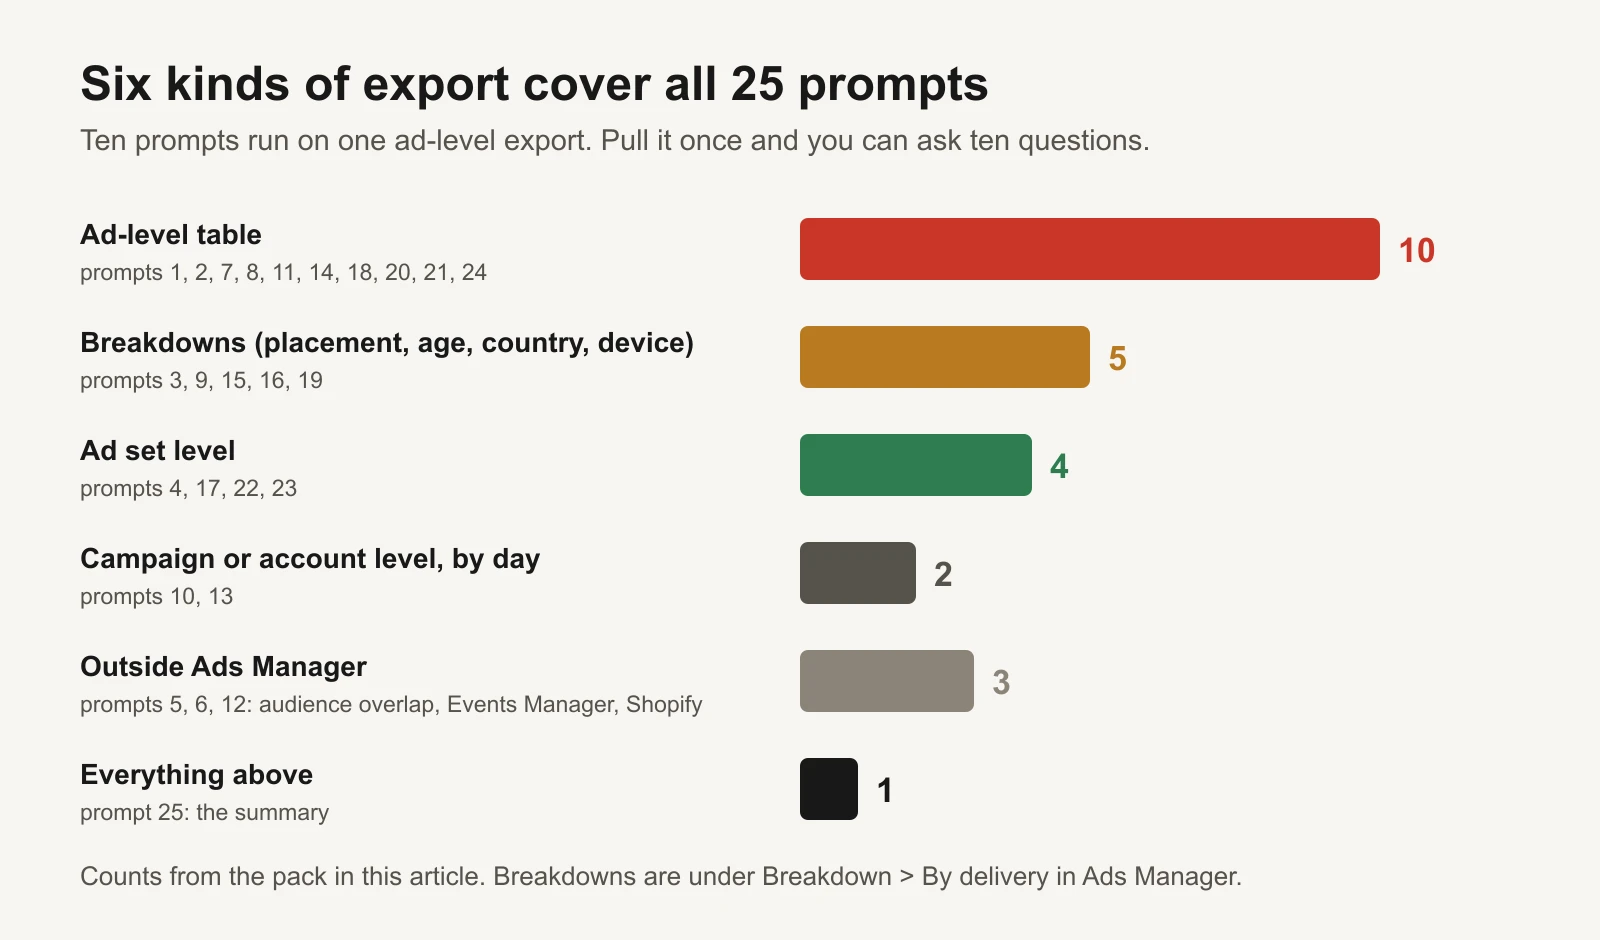
| Export | How to pull it | Prompts |
|---|---|---|
| Ad-level table | Ads tab, your date range, Columns: Amount spent, Purchases, Purchase conversion value, Link clicks, CTR (link click-through rate), Landing page views, Website URL, Frequency, Impressions, 3-second video plays. For prompt 2, export it a second time with Breakdown, By time: Week, over the last 8 weeks | 1, 2, 7, 8, 11, 14, 18, 20, 21, 24 |
| Breakdowns | Ad sets or Campaigns tab, Breakdown, By delivery: Placement, Age, Country or Impression device. One breakdown per file | 3, 9, 15, 16, 19 |
| Ad set level | Ad sets tab, add Delivery, Budget, Bid strategy, Reach, Frequency, Results | 4, 17, 22, 23 |
| By day | Campaigns tab, Breakdown, By time: Day | 10, 13 |
| Outside Ads Manager | Audience overlap screenshot, Events Manager screenshots, Shopify sales by day | 5, 6, 12 |
| Your earlier answers | Nothing to export | 25 |
The 25 prompts
Each row is the question, the export it needs and what to ask. The workbook wraps each "what to ask" in the template above.
| # | Question | Export it needs | What to ask |
|---|---|---|---|
| 1 | Rank every ad by spend with 0 purchases | Ad level, last 30 days: spend, purchases, purchase value | List every ad with zero purchases, sorted by spend, with the total. Mark those that spent over 1.5x target cost per purchase |
| 2 | Which ads are past 4.0 frequency and losing CTR? | Ad level, last 8 weeks, by week: frequency, link CTR, impressions, spend | Find the week each ad's frequency first passed 4.0; compare link CTR before and after. List ads down 25% or more |
| 3 | Where is the dead money by placement? | Ad set level, 30 days, placement breakdown | List placements with over 5% of spend and zero purchases or cost per purchase over 1.5x target |
| 4 | Which ad sets never left learning? | Ad set level, 7 days: Delivery, Results, spend, budget | List ad sets in Learning or Learning limited with their purchases; suggest merges so each gets closer to 50 a week |
| 5 | Does retargeting overlap prospecting? | Audience overlap screenshot (if your account shows it) plus ad set names | Which audience pairs overlap by over 20%, which ad sets use them, and which exclusion to add |
| 6 | Is the Conversions API double-counting purchases? | Events Manager screenshots of the Purchase event, plus your store's daily orders | Are browser and server events deduplicated? What's the match quality? Gap between Events Manager and store orders, in percent |
| 7 | Which hooks win across all my ads? | Ad level, 30 days, hook type in the ad name | Group by hook type; compare spend-weighted ROAS and cost per purchase. Only groups with 3x target cost per purchase in spend |
| 8 | What share of spend sits on 3 ads? | Ad level, 30 days | Share of spend on the top 3 ads, and each one's ROAS against break-even |
| 9 | Which age bands lose money? | 30 days, age breakdown | Spend, purchases, cost per purchase and ROAS by age band; flag bands under break-even with over 10% of spend |
| 10 | Did my last budget raise break anything? | Campaign level, 30 days, by day | Find days spend jumped 20%+ over the prior 7-day average; compare cost per purchase 3 days after with 7 days before |
| 11 | Which creatives are 30+ days old? | Ad level, 30 days, plus each ad's launch date | Ads launched over 30 days ago, share of spend, cost per purchase; the 3 to refresh first |
| 12 | What is my real blended ROAS? | Campaign level by day, plus Shopify sales by day | By day and in total: store sales ÷ Meta spend next to Meta's reported ROAS, with the gap explained |
| 13 | Which days of the week burn cash? | Account level, 8 weeks, by day | Cost per purchase by weekday; flag days 30%+ above average and say if there are enough purchases to trust it |
| 14 | Which ads have the best thumb-stop? | Ad level, 30 days, video: impressions, 3-second plays, ThruPlays | Hook rate = 3-second plays ÷ impressions. Rank ads with 1,000+ impressions; what do the top 3 share? |
| 15 | Are Reels or Feed cheaper per purchase? | Ad set level, 30 days, placement breakdown | Cost per purchase in Reels vs Feed, Facebook and Instagram separately; only placements with 10+ purchases |
| 16 | Which countries convert worst? | Campaign level, 30 days, country breakdown | Rank countries by cost per purchase; flag those with over 5% of spend above 1.5x target |
| 17 | Grade my campaign structure A to F | Campaign and ad set level, 30 days | Count overlapping campaigns, ad sets under 50 purchases a week and ad sets whose names suggest the same audience; grade it in 5 lines |
| 18 | Which landing pages lose the click? | Ad level, 30 days: link clicks, landing page views, purchases, plus each ad's landing page | By page: clicks, page views, purchases, click-to-view rate, purchases per click; flag the weakest |
| 19 | Did iOS users stop converting? | This month and last month, impression device breakdown | Cost per purchase by device across the two months; flag rises of 20%+ |
| 20 | Which ads to scale tomorrow? | Ad level, last 7 days, with frequency | Ads above target ROAS, frequency under 2.5, spend of 3x target cost per purchase; rank them for a 20% budget step |
| 21 | What should my next 5 tests be? | Ad level, 90 days | What separates the best and worst ads; 5 one-variable tests ranked by money at stake |
| 22 | Am I bidding on cost cap too tight? | Ad set level, 30 days: bid strategy, cap, budget, spend | Cost cap and bid cap ad sets: spend vs budget, cost per purchase vs cap; which are starved? |
| 23 | Which audiences are exhausted? | Ad set level, 8 weeks, by week: reach, frequency | Ad sets with flat or falling reach for 2+ weeks while frequency rises, with their cost per purchase trend |
| 24 | Where am I paying for clicks, not sales? | Ad level, 30 days: link clicks, link CTR, purchases, spend | Ads with above-average CTR but under half the average purchases per click, with their spend |
| 25 | Write my audit summary for my boss | Your answers above, same chat | A 10-line summary: grade, the 3 biggest leaks in dollars a month, the first 3 fixes. No new numbers |
A few notes on the less obvious ones:
- Prompt 4 uses Meta's learning phase. An ad set usually needs about 50 optimization events in 7 days to leave it (Meta: About the learning phase). Many small ad sets that never get there are a common, fixable leak.
- Prompts 5 and 6 work from screenshots, because those views don't export cleanly. All three AIs read images. If your account no longer shows the audience overlap view, skip prompt 5.
- Prompt 12 is the one owners care about most. Our Meta vs Shopify attribution guide explains why the two numbers never match and which one to budget on.
- Prompt 7 only works if your ad names say what each ad is. If they don't, fix the naming first.
Check the AI's sums before you act
AIs are good at reading tables and bad at being reliably exact. Before you pause, cut or scale anything, re-do the one number the decision rests on.
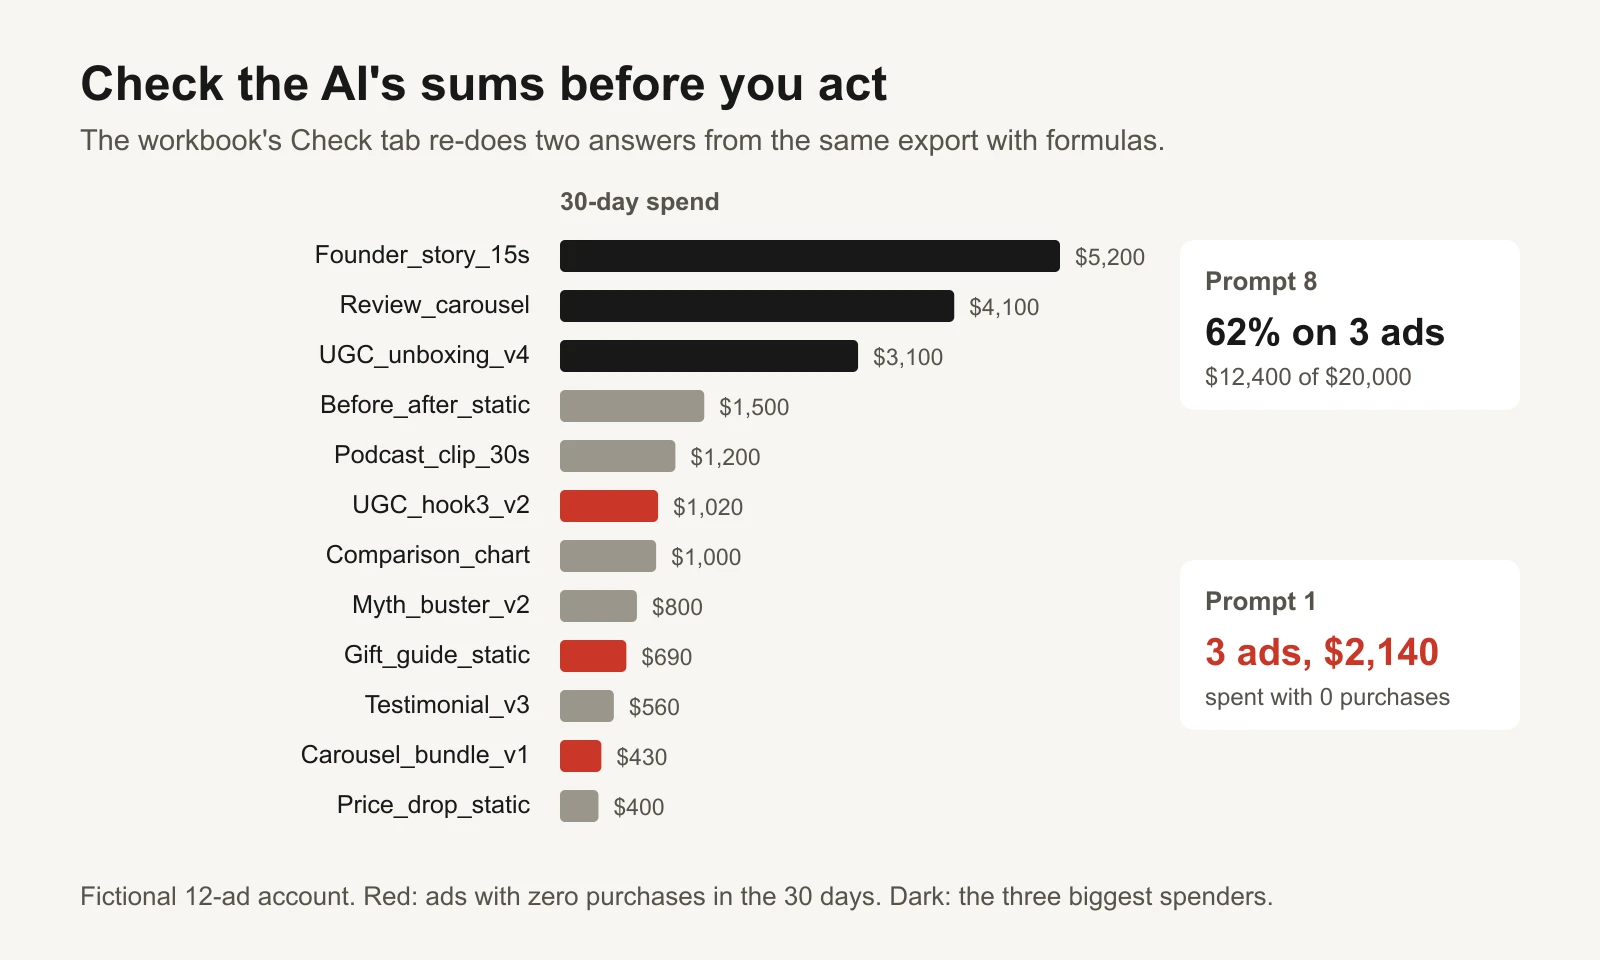
Fictional account. The Check tab works these out with formulas from the same export.
In our worked example, the account spent $20,000 in 30 days across 12 ads. The workbook's Check tab, with the export pasted in, gives:
| Answer | Formula result |
|---|---|
| Prompt 1: ads with zero purchases | 3 ads, $2,140 |
| Prompt 8: share of spend on the top 3 ads | 62% ($12,400 of $20,000) |
| Account ROAS | 2.63 (break-even 2.5) |
| Cost per purchase | $45.15 (target $40) |
If the AI's number differs, ask it to list the rows it summed. The usual culprits are a totals row at the bottom of the export, a filter you forgot, or two exports with different attribution settings.
Log what you find
The Findings tab is one row per answer you'll act on: the prompt number, what the AI found, the dollars a month at stake, whether you checked the sum, the action, an owner and a status. Unchecked rows stay amber. Sort by dollars at stake and work top down.
In the example, the first three rows are the $2,140 on zero-purchase ads (checked, done), Audience Network at 9% of spend with no purchases ($1,800, still to check), and Sunday costs per purchase of $61 against $38 on weekdays (to check: are there enough Sunday purchases to trust it?).
Which AI should you use?
Any of the three. We haven't run a side-by-side test of Claude, ChatGPT and Grok on real accounts, so we won't claim one wins. What decides the quality of the answer here is the prompt and the file, and those are the same in all three. If you want the same audit run the same way every week, the Claude Meta Ads audit skill turns a fixed rubric into a reusable skill that grades every ad A to F.
Or let GaaS ask the questions
GaaS is an AI agent that creates, launches and optimises Meta and Google ads from three inputs: your website, a spend limit and a one-line goal. It reads your account directly, every day, and asks before anything that changes spend. If you'd rather run the audit yourself, the pack and workbook are free.
Limits
- The AI only sees the file you attach. Anything not in the export (your margin, stock levels, a sale you ran) has to be in the prompt.
- Ads Manager numbers depend on the attribution setting and are modelled in part. Platform-reported purchases rarely match your store's orders exactly.
- The thresholds in the prompts (1.5x target, 4.0 frequency, 25% CTR drop, 20% budget jump) are our starting points, not Meta rules. Change them in the "What to ask" column.
- Small numbers mislead. A weekday or country with 6 purchases can't prove much; prompts 13, 15 and 16 ask the AI to say so.
- Don't paste customer names, emails or other personal data into an AI. Ads Manager exports don't contain them; Shopify exports can.
Sources
- Meta Business Help Center: About the learning phase
- Coinis: How to export Facebook Ads data to CSV (third-party guide)